Physical Address
304 North Cardinal St.
Dorchester Center, MA 02124
Physical Address
304 North Cardinal St.
Dorchester Center, MA 02124


Copenhagen, not Vienna, ranked first in the Economist Intelligence Unit’s Global Liveability Index released on June 16, 2025, ending Vienna’s three-year run at the top. So the simple headline answer is clear: Vienna did not keep beating Copenhagen on the most cited current livability table. But that is also why this story became more interesting. The real question is whether Copenhagen genuinely became more livable for residents overall, or whether the ranking system shifted in a way that favored Copenhagen’s visible strengths more than Vienna’s deeper structural advantages.
This is what makes the Vienna versus Copenhagen comparison more than a rankings recap. It is a test of what global livability indexes actually reward. Copenhagen scored perfectly in stability, education, and infrastructure in the EIU’s 2025 release. Vienna lost ground mainly because of a weaker stability score after reported incidents in 2024 and 2025. That means the outcome was not driven by a collapse in Vienna’s housing model, transit performance, or everyday urban function. It was driven by how one category moved enough to change the table.
The takeaway is not that Vienna suddenly became worse. It is that one of the world’s most cited rankings can flip the winner without proving that the underlying city model has been overtaken. Copenhagen won the headline. Vienna may still have the stronger long-run case in the parts of urban life that are hardest to replace quickly, especially housing security and system-level affordability. That does not mean Copenhagen stole the ranking. It does mean readers should ask whether the ranking measured the full substance of urban livability or just the categories that moved most visibly in one year.
The Economist Intelligence Unit assessed 173 cities across 30 indicators in five categories: stability, healthcare, culture and environment, education, and infrastructure. Copenhagen scored 100 in stability, education, and infrastructure. Vienna’s drop was tied to a lower stability score after reported security incidents in 2024 and 2025. That makes the result understandable, but it also explains why the outcome feels debatable to many readers. A city can retain the same transport network, the same housing institutions, and the same broad quality of everyday services, yet still lose first place because one category carries enough weight to move the overall ranking.
That is why the phrase “Copenhagen beat Vienna” needs context. It is true within the EIU’s 2025 framework. It is not automatically true across all definitions of livability. The ranking did not prove that Copenhagen suddenly solved urban life more completely than Vienna. It showed that Copenhagen matched the EIU’s scoring logic better in that year, while Vienna became more vulnerable in the stability component. Those are not the same claim.
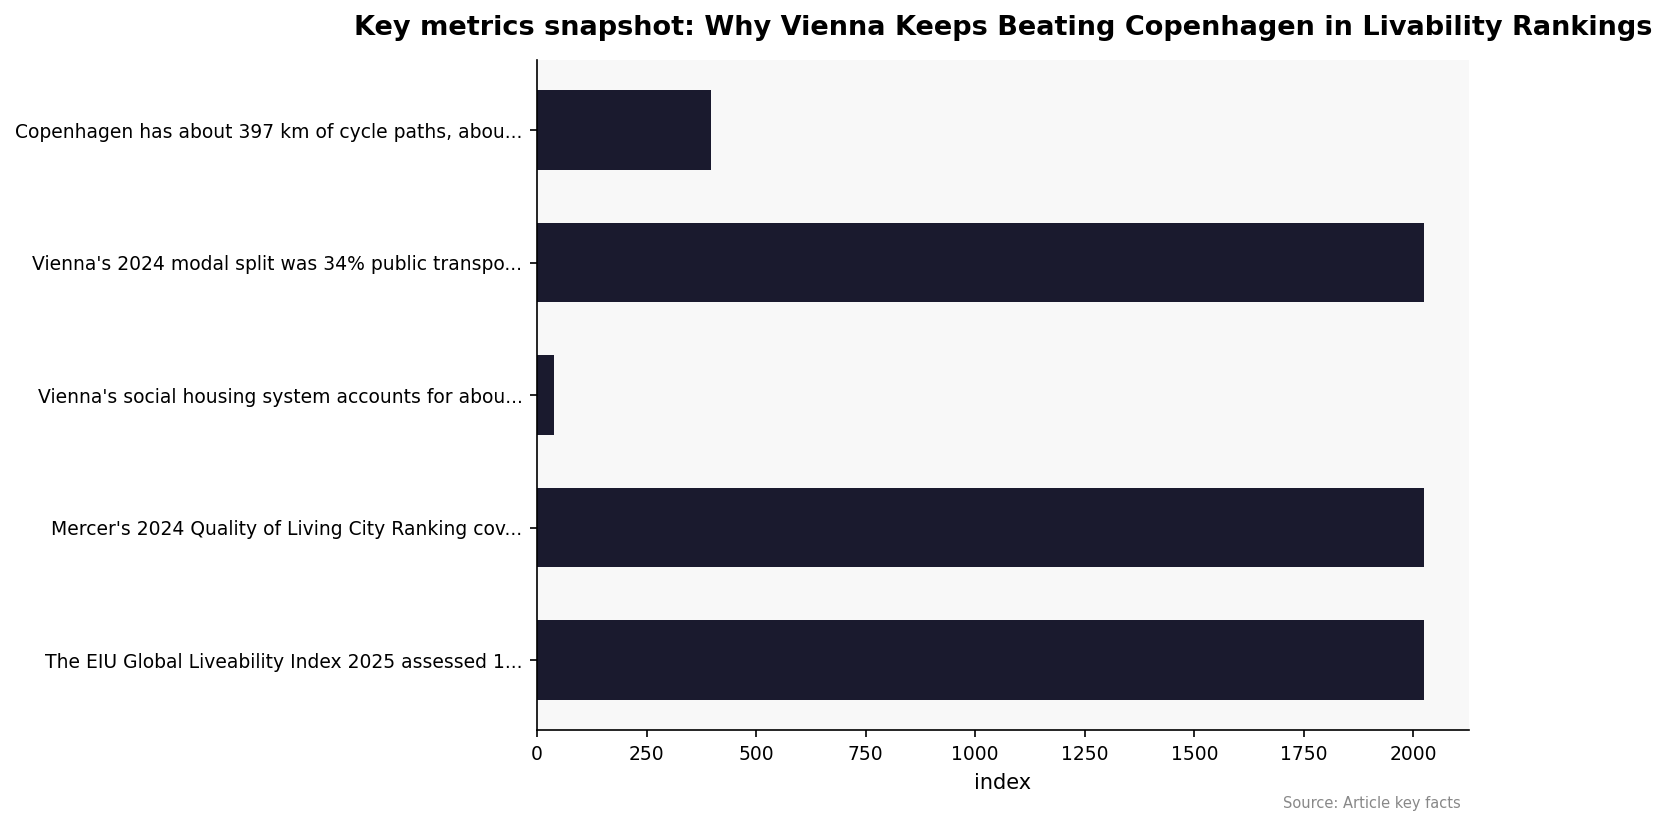
Livability rankings are composite indexes, not full urban biographies. Each one turns a wide set of conditions into a single order of cities, but they do not weight the same things equally and they are not built for the same audience. The EIU index uses 30 indicators across five categories. Mercer’s 2024 Quality of Living City Ranking covered 241 cities and was designed around quality of living for international employees. Monocle’s 2025 Quality of Life Survey used a broader editorial urbanism lens and placed Paris first, not Vienna or Copenhagen.
That difference matters because rankings are often treated as if they were neutral verdicts. They are not. They are structured arguments about what counts. A housing system built over decades may matter enormously to real residents but still receive less public attention than a category swing in stability or visible infrastructure quality. A city with excellent bike infrastructure may benefit more in ranking narratives because its advantages are easier to score, photograph, and compare. A city with deep housing resilience may deliver more durable benefits to residents while being less legible in a one-line headline.
That is why Vienna versus Copenhagen is such a good case study. It forces a distinction between a city that scores strongly through visible, measurable mobility performance and a city whose biggest strengths sit inside institutions that reduce pressure over time. Copenhagen’s model is highly visible. Vienna’s model is highly structural. Both are powerful. Not every ranking captures both equally well.
Copenhagen replaced Vienna as the world’s most liveable city in the 2025 EIU index. The ranking covers 173 cities and uses 30 indicators across stability, healthcare, culture and environment, education, and infrastructure. Copenhagen scored 100 in stability, education, and infrastructure, according to the EIU ranking release.
Vienna’s drop was narrow but consequential. The city’s weaker result was tied to a lower stability score after reported security incidents in 2024 and 2025. That tells readers something important about how these tables work. A city can keep most of its daily-life advantages and still lose first place if one category slips enough. In other words, Copenhagen did not need to demolish Vienna’s entire urban model to take the top spot. It only needed to outperform Vienna inside the scoring logic of that year’s index.
This is also why the result was partly expected but easy to misread. It was expected in the sense that rankings with a meaningful stability component will punish visible incidents. It was not expected if someone assumed Vienna’s long-standing strengths in housing, public services, and urban management would automatically protect its top position. They did not. The EIU table proved that no amount of accumulated structural strength guarantees first place when one component moves sharply enough.
The fairest answer is: both, but not in the same way. Copenhagen fairly won the EIU’s 2025 ranking because it matched the published criteria better that year. There is no evidence that the ranking was stolen, manipulated, or unfairly assigned. But it is also fair to say that the result reflects the structure of the index as much as it reflects the total lived reality of both cities. That is where the controversy lives.
If a ranking gives enough weight to stability and visible infrastructure quality, Copenhagen becomes a natural beneficiary. It has a globally recognizable cycling system, strong public-realm performance, and a city image that aligns neatly with contemporary urban success metrics. Vienna’s biggest comparative weapon is less cinematic. It is a housing system of unusual scale, permanence, and social reach. That may matter more to long-term livability than a one-year score swing, but it does not always dominate a headline ranking.
So did Copenhagen “steal” the ranking from Vienna? No, not in the literal sense. But did the rules of measurement produce a winner that looks more decisive than the underlying urban reality probably is? Yes, that is a much stronger argument. The ranking was fair within its own rules. The public interpretation often becomes unfair when people treat that one result as proof that Vienna’s model has been surpassed across the board.
The Vienna advantage looks stronger if the comparison runs beyond the EIU’s 2025 table. Mercer’s 2024 ranking placed Zurich first, Vienna second, Geneva third, and Copenhagen fourth, according to the Mercer ranking page. Vienna also led Mercer’s table from 2009 until being overtaken in 2024. That is not a one-off success. It is long-run consistency under a different measurement system.
Monocle points in a third direction. Its 2025 Quality of Life Survey was led by Paris, and Monocle did not place Vienna above Copenhagen that year, according to the Monocle 2025 survey. No single index settles the question. Zurich, Geneva, Paris, Vienna, and Copenhagen all appear near the top of these lists, but for different reasons and under different measurement logic.
This matters because the “who beat whom” framing only works if all rankings are measuring the same thing. They are not. A city can lose one table, hold up strongly in another, and still deliver excellent outcomes for residents in both cases. That weakens simplistic victory language. It also strengthens the article angle, because the real story is no longer just who ranked first. It is why different institutions keep rewarding different urban models.
Vienna’s strongest planning asset is housing at institutional scale. Social housing accounts for about 40% of total housing stock and about 45% of primary-residence flats, with roughly 220,000 municipal flats and about 185,000 flats owned by limited-profit housing associations, according to the IBA Vienna housing overview. That is a very large non-market or limited-profit segment for a major European capital. The city’s permanently access-restricted housing stock rose from about 210,000 in 1970 to around 400,000 today.
This is where Vienna’s case becomes stronger than a simple ranking suggests. Housing is not just a comfort variable. It shapes affordability, labor market access, commuting burdens, household stability, and the ability to remain in the city through income changes. A city that gets housing right at scale changes daily life in a way that is hard to replicate through branding or surface-level infrastructure alone. This is also why many planners view Vienna as structurally formidable even when it loses a headline index.
That makes Vienna’s long period near the top less mysterious and more deserved. The city was not floating on image. It was benefiting from institutions that materially lower urban pressure. If an index captures the downstream outcomes but does not spotlight the housing machinery itself, Vienna can look strong without the public fully understanding why. That weakens popular interpretations of the table, but it also suggests Vienna’s advantage may be more durable than a single year’s result implies.
Copenhagen’s case in the available source material is less about housing and more about highly visible transport quality. The city has about 397 km of cycle paths and about 745,000 bicycles, according to Le Monde’s 2024 reporting on Copenhagen’s low-carbon transport model. Within the city, 45% of journeys to work or school are made by bike. Bicycles account for 27% of all journeys to, from, or within the city, compared with 29% by car.
These are not cosmetic gains. They represent a mature mobility system with real everyday value. Copenhagen deserves enormous credit for building a city that makes cycling feel normal rather than niche, and that is one reason it performs so well in rankings and in global urban imagination. The city did not luck into this reputation. It earned it through infrastructure, continuity, and culture.
At the same time, Copenhagen’s strengths fit ranking frameworks especially well because they are concrete, legible, and easy to benchmark. A cycle network can be counted. Bike mode share can be charted. Streets can be photographed and internationally understood in seconds. That does not make Copenhagen’s success less real. It does help explain why the city can look especially powerful in indexes that favor visible urban performance.
Vienna’s mobility profile is broad-based rather than bike-dominant. The city’s 2024 modal split was 34% public transport, 30% walking, 11% cycling, and 25% car, according to the official Vienna modal split release. That means 75% of trips were made by public transport, walking, or cycling. Car share fell from 40% in 1993 to 25% in 2024. Vienna planned more than 20 km of new cycle routes in the main network for 2025.
The contrast is clear. Vienna spreads demand across transit and walking, with cycling smaller but growing. Copenhagen concentrates more of its urban identity in the cycling network. That distinction affects planning choices and how rankings capture them. Copenhagen’s transport story is easier to narrate in one image. Vienna’s is more system-wide and less visually singular. That does not make Vienna weaker. It makes Vienna harder to summarize.
This is one of the reasons the public can come away with the wrong impression. If you only look at the most photogenic urban asset, Copenhagen feels like the obvious winner. If you look at housing plus transit plus walkability plus long-run social stability, Vienna’s case becomes heavier. One model is easier to celebrate in headlines. The other may be harder to dislodge in real life.
Residents in Vienna benefit most directly from the housing side of this comparison, especially households using municipal or limited-profit stock across the city’s primary residence market. The scale matters because the system is not confined to one showcase district. It shapes access across broad parts of Vienna. Commuters also benefit from a mobility network where non-car modes account for 75% of trips, but the housing system is what helps many households remain close enough to those networks for them to matter.
In Copenhagen, the most visible gains accrue to daily cyclists and workers moving within the municipality, where bikes account for 45% of work and school journeys. Geography matters here. That figure covers travel within the city, not the whole metropolitan region. Once the trip area expands, car use rises to 29% of all journeys. That is still impressive by international standards, but it means the benefits are not distributed in exactly the same way across every travel context.
Planners, employers, and relocation teams also feel the difference. Rankings shape talent marketing, investment narratives, and city branding. They influence how Vienna, Copenhagen, Zurich, and Paris are pitched to firms and mobile workers. Durable outcomes, though, come from institutions that survive political cycles. Vienna’s housing model fits that pattern. Copenhagen’s street and cycling model does too. Residents live inside those systems long after a ranking changes.
Yes, the win was fair inside the ranking’s method. Copenhagen satisfied the EIU’s scoring framework better in 2025, and Vienna lost points where the framework was designed to penalize weakness. There is nothing inherently unfair about that. The ranking did exactly what it said it would do.
But the broader public conclusion can become unfair if it goes too far. Saying “Copenhagen ranked first in the EIU’s 2025 liveability index” is correct. Saying “Copenhagen clearly surpassed Vienna as the better city model” is a much larger claim that the available ranking evidence does not fully prove. Different indexes did not produce the same winner. Vienna’s biggest comparative strength, housing, remains unusually large and durable. Copenhagen’s biggest comparative strength, cycling and visible infrastructure quality, remains unusually strong and highly measurable. A one-year table cannot settle all of that.
As for whether the result was expected, the best answer is: partly. It was expected that stability incidents could hurt Vienna in an index that weights stability meaningfully. It was less expected that this would be read as a definitive urban handover rather than a category-driven shift. The result makes sense. The sweeping narrative built on top of it often goes too far.
Vienna is still well placed if the next few years reward structural planning assets again. Its housing base is large, durable, and difficult for peer cities to replicate quickly. Its mobility mix is also moving in a favorable direction, with more than 20 km of new cycle routes planned for 2025. If stability scores normalize, Vienna has the institutional depth to regain first place in some indexes.
Copenhagen, meanwhile, remains one of the world’s clearest examples of how street design and mobility quality can transform urban life. Its win should not be dismissed. It is a real achievement, and it reflects decades of planning discipline. But the bigger lesson is not that one city exposed the weakness of the other. It is that two elite urban models are being judged through imperfect but influential frameworks that do not always reward the same qualities.
The strongest conclusion is this: Copenhagen won the latest headline ranking, but Vienna did not suddenly lose the argument on livability. If anything, the 2025 shift exposed how much these rankings depend on what they count, how they weight it, and how willing readers are to confuse a table with the deeper system underneath it.
Did Vienna actually beat Copenhagen in 2025?
No. Copenhagen ranked first in the EIU Global Liveability Index released on June 16, 2025. Vienna’s three-year run at the top ended there.
Did Copenhagen steal the ranking from Vienna?
No in the literal sense. Copenhagen fairly won under the EIU’s published method. But the broader debate is valid because the result reflects how the index weights stability and visible infrastructure, not necessarily every long-run feature of resident wellbeing.
Was Copenhagen’s win fair?
Yes, within the EIU’s framework it was fair. Copenhagen scored better on the criteria that determined the 2025 outcome. The more arguable question is whether that framework captures the full substance of livability as residents experience it over time.
Was Vienna’s loss expected?
Partly. It was expected that a lower stability score could hurt Vienna in a ranking that gives stability meaningful weight. What was less expected was how quickly that would be interpreted as a total urban reversal rather than a category-driven change.
Why has Vienna been so strong in these rankings over time?
The clearest structural explanation is its large non-market and limited-profit housing system. Social housing accounts for about 40% of total housing stock, which supports long-term access, affordability, and urban stability.
Mobility infrastructure. The city has about 397 km of cycle paths, about 745,000 bicycles, and a 45% bike share for work and school trips within the city, making it one of the clearest high-performance cycling capitals in the world.
Because they use different methods and serve different audiences. EIU scores cities across five liveability categories. Mercer focuses on quality of living for international employees. Monocle uses a broader editorial survey model. Different methods naturally produce different winners.
Do not confuse the table with the system. Copenhagen won the latest headline ranking, but Vienna’s housing institutions and broad-based urban model remain exceptionally strong. One-year ranking shifts can reflect genuine change, measurement bias, or both at once.
This story matters because global city rankings increasingly shape how places are marketed to investors, employers, mobile talent, tourists, and policymakers. A city that tops a major index can turn that result into a branding asset overnight. But the Vienna-Copenhagen comparison shows why those headlines need restraint. The EIU’s 2025 result is real, but it sits inside a wider field where Mercer, Monocle, and other frameworks reward different kinds of urban strength. Readers looking for a clean “winner” will find one only if they ignore how much depends on the scoring system.
For residents, the practical implications are larger than the rankings headline suggests. Vienna’s housing system affects rent pressure, household security, and long-term access to the city. Copenhagen’s mobility model affects daily travel time, street safety, and quality of movement. For investors and employers, the ranking shift may strengthen Copenhagen’s international appeal in the short term. For planners, the lesson is sharper: cities can build world-class systems and still be judged very differently depending on whether an index rewards visible infrastructure, social stability, or deep institutional capacity. That is why the 2025 result is worth reading as both an urban outcome and a measurement story.