Physical Address
304 North Cardinal St.
Dorchester Center, MA 02124
Physical Address
304 North Cardinal St.
Dorchester Center, MA 02124

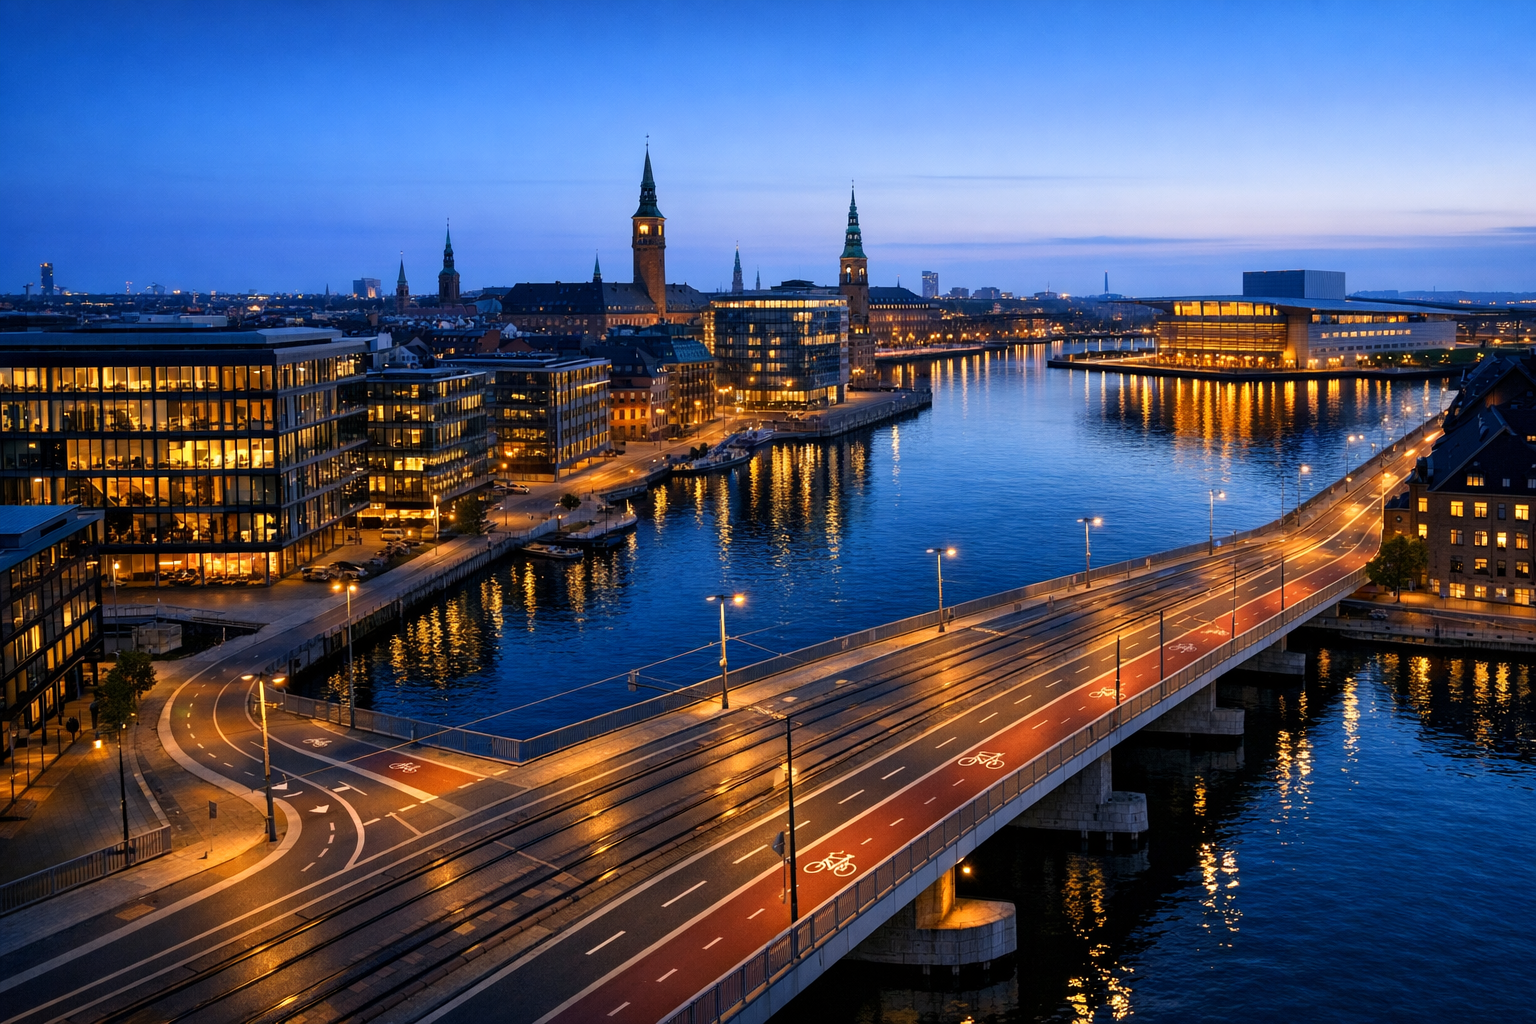
Copenhagen took first place in the EIU’s 2025 Global Liveability Index, replacing Vienna at the top of one of the world’s most cited urban rankings. That result was widely reported as a verdict on which cities “work best,” even though the biggest liveability tables do not measure the same thing and were not built for the same public.
The evidence points to a structural tilt rather than a simple conspiracy. Rankings built around stability, service quality, healthcare, infrastructure reliability, and international mobility will keep rewarding cities that are already rich, institutionally strong, and low-risk. That does not make the results false. It does mean they are often read far beyond what their methods can justify, especially when people treat them as a full measure of how well a city serves all residents.
Public debate about liveability rankings often treats them as neutral scoreboards. The sharper question is methodological. EIU, Mercer, Monocle, and UN-Habitat are measuring different things, across different years, for different users, and with different levels of transparency. That matters because these tables influence city branding, policy narratives, media framing, and external perceptions long after the yearly ranking cycle ends.
The immediate trigger for this debate was the latest reshuffle at the top of the EIU index. The 2025 Global Liveability Index covers 173 cities and uses more than 30 indicators across stability, healthcare, culture and environment, education, and infrastructure. The Economist’s June 2025 summary reported that Copenhagen ranked first and that Vienna lost the top spot, with instability playing a larger role in some score changes.
That kind of movement matters because it changes headlines, but it can also encourage people to overstate what the rankings prove. A change at the top does not mean one city suddenly became the best place on earth for every resident, family, worker, student, or retiree. It means one city scored higher under a particular model built around a specific bundle of indicators.
Liveability lists are not just magazine filler. They become soft governance tools. When a city places near the top, officials can cite the result as external validation of public policy, urban management, or strategic vision. The 2019 critique republished by the World Economic Forum argued that annual rankings trigger repeated debate about blind spots and can be selectively used by city leaders to support a preferred story about urban success.
That critique predates the latest rankings, but the methodological point remains relevant because the ranking formats still have not converged on a resident-equity model. City governments operate under pressure to show measurable progress, and a high-profile ranking gives them a simple story that travels faster than a complex dashboard on housing access, affordability, congestion, inequality, or school quality by district.
Liveability rankings are composite indexes. They combine multiple indicators into a single score, then order cities from highest to lowest. The method looks technical, but each index begins with a choice about audience and purpose. A relocation tool for employers asks different questions from a public-interest assessment of whether residents can access healthcare, education, safe streets, affordable housing, reliable transport, and functioning local government.
That distinction is why the bias question cannot be answered by looking only at the winners. A ranking can be internally consistent and still narrow in scope. It may capture exposure to disruption, service reliability, or international mobility conditions well, yet still miss affordability pressures, inequality within the city, or the quality of local democratic accountability. In practice, these systems are best read as designed instruments, not neutral summaries of urban life. The real governance issue is who defines the benchmark and whose daily experience counts inside it.
One of the biggest blind spots is distribution. A city can have excellent infrastructure on average and still expose outer-district residents to longer travel times, overcrowding, weak public amenities, or poor access to jobs. It can score highly on education and healthcare while remaining unaffordable for households priced out of high-performing neighborhoods. A city can be “livable” on paper and still feel exclusionary in practice.
The Mercer system is the clearest example of purpose shaping outcome. Mercer’s public page says its Quality of Living City Ranking covers 241 cities worldwide and is used to compare living conditions for international assignees. Its methodology paper says the model uses 39 factors in 10 categories and is designed to support hardship allowances and assignment policy. That is not hidden fine print. It is the core use case.
That does not make Mercer’s ranking wrong. It makes it specialized. For multinational employers deciding how difficult or costly an overseas posting might be, that kind of system is useful. For citizens asking whether a city is fair, affordable, inclusive, and supportive of everyday life across income groups, it is an incomplete proxy. The same is true, in different ways, for any ranking built around a narrow user brief.
Three major ranking families dominate public discussion, and they operate differently. The EIU index is a broad comparative model with a relatively large city sample. Mercer is a corporate mobility product built around assignment conditions. Monocle is a narrower editorial survey. Monocle’s 2025 survey is the 18th annual edition, ranks 10 cities, and judges them using factors such as health, safety, housing, and nightlife. That mix is explicit about judgment as well as data.
A public-interest alternative looks different again. UN-Habitat’s 2025 pilot report does not present one simple hierarchy as the main product. It emphasizes domain-level variation and says cities can show strengths in different areas rather than conforming to a single winner-loser table. In the pilot, Kampala records a Health domain score of 73.9. That single result does not prove a full ranking reversal, but it does show that different briefs surface different urban strengths, especially outside the usual pool of affluent cities.
The blind spots recur across ranking formats. The 2019 WEF critique argued that liveability systems should better reflect housing, infrastructure, public space, social inequality, community strength, economic resilience, quality of government, and public finances. Some of those are partly present in existing systems. What is weaker is their treatment of access, distribution, and affordability across the city.
That matters because average performance can hide unequal outcomes. A city may have strong transit coverage overall but leave peripheral neighborhoods with slow bus links or poor late-night service. It may score well on public order and still feel inaccessible to low-income households pushed farther from jobs and services by rising rents. These are not side issues. For many residents, they are the city.
The pattern is visible even before a full quantitative test. The Economist’s 2025 summary said the highest places are concentrated in Western Europe and parts of the Asia-Pacific. That concentration lines up closely with the categories being measured. Wealthy cities tend to have stronger baseline health systems, more resilient infrastructure, lower perceived disruption risk, and higher institutional capacity to maintain services over time.
Those are not trivial advantages. They are the product of long investment cycles, national support systems, stable governance, and deeper fiscal capacity. The problem is not that these strengths are being rewarded. The problem is that the resulting rankings are then casually presented as if they settle a wider public question: which cities are best for human life overall. That leap is where the bias claim becomes persuasive.
The first group affected is city leaders and development agencies. A high rank can strengthen a city’s narrative in investment promotion, tourism, talent attraction, and inter-city competition. The second group is employers, especially multinational firms choosing assignment locations or setting compensation packages. The third group is residents, though often indirectly. Rankings shape what gets celebrated inside the city, which can influence how media and business groups talk about infrastructure, safety, public space, and service delivery across central districts and metropolitan regions.
The geography matters. In Copenhagen, Vienna, and Zurich, a high score reinforces an already strong international brand. In places that rarely reach those tables, the effect can be more distortive. Officials may chase visible metrics that map neatly onto international ranking systems rather than harder distributional work such as reducing overcrowding, improving peripheral bus links, cutting commute inequality, or addressing unequal school access.
Residents in outer suburbs, low-income districts, and informal settlements are the least likely to see their daily experience reflected in expatriate-oriented or editorial systems. A liveability index can describe a city’s average operating conditions. It can also miss who is excluded from those conditions and who has to pay the highest price to access them.
Comparison matters because the bias claim is partly about benchmark choice. EIU, Mercer, Monocle, and UN-Habitat are not rival brands measuring one stable object. They are better understood as different instruments aimed at different questions. Direct top-10 comparisons can mislead readers into seeing consensus where there is only partial overlap among affluent, service-rich cities.
| System | Main audience | Coverage | Method signal |
|---|---|---|---|
| EIU 2025 | General comparative use | 173 cities | 30+ indicators, 5 categories |
| Mercer 2024 | International assignees | 241 cities | 39 factors, 10 categories, hardship use |
| Monocle 2025 | Editorial audience | 10 cities | Data plus editorial judgment |
| UN-Habitat 2025 pilot | Public-interest quality of life | Pilot cities | Domain strengths rather than one simple hierarchy |
The comparison also helps explain why a city such as Kampala can appear as a domain-strength case in UN-Habitat without appearing near the top of commercial tables. The frameworks are asking different questions. For readers interested in urban governance, the practical lesson is to treat rankings as selective lenses, not final verdicts.
The most accurate answer is that they are useful but often over-read. They are right within the limits of their own design, but wrong when presented as complete judgments about how well cities work for everyone. A ranking built for expat mobility, corporate assignment policy, or a curated editorial readership cannot automatically serve as a democratic scorecard for resident well-being.
That is why the debate should not be framed as “trust the ranking” versus “ignore the ranking.” The real question is whether readers understand what the ranking was built to see. A table that prioritizes stability, healthcare systems, infrastructure quality, and low disruption will continue to elevate wealthy, orderly, service-rich cities. That is not evidence of fraud. It is evidence of scope.
The most durable critique is not that rankings are useless. It is that they are often used far beyond their intended purpose. The WEF republished analysis called for more holistic measures aligned with the public interest, including inequality, public finance, and community strength. That argument fits with newer work from UN-Habitat and with the OECD’s broader well-being evidence.
It also points to a policy gap. Cities have many dashboards for transport, housing, emissions, finance, and neighborhood-level performance, but the public conversation still gravitates toward a single cross-city rank because it is legible, annual, and easy to circulate. In media terms, one number travels farther than a serious dashboard ever will. That is exactly why the framing matters so much.
The ranking industry is unlikely to shrink. Employers still need location tools. Media organizations still want annual lists. Cities still want usable external signals. The likely shift is methodological pressure, not disappearance. Public-interest institutions are putting more emphasis on domain-level performance, resident perception, and context-sensitive comparison.
That will not produce one global winner every year, which is precisely why it may be more useful for governance. A city government deciding where to invest next needs to know where residents are underserved, not simply whether the city climbed from fourth to second in a table designed for international visibility.
Readers should keep the date mismatch clear. The latest headline data here are EIU 2025, Monocle 2025, and Mercer 2024. The WEF critique is from 2019, and it should be read as a methodological warning rather than a current event. Even with that caveat, the central pattern holds. The structural tilt is less about malicious bias than about design. A ranking built around affluent-city strengths will keep finding affluent-city winners.
For city residents and local policymakers, the key takeaway is practical rather than abstract. A high livability rank can help a city’s image, but it does not automatically mean housing is affordable, commuting is fair, schools are equally accessible, or peripheral districts enjoy the same quality of public services as the center. The rankings are most useful when read alongside local data on rents, transport access, public safety by district, overcrowding, service coverage, and resident satisfaction.
That is especially important in cities trying to improve their international reputation. Chasing the optics of a global ranking can encourage visible upgrades in central districts while leaving harder equity problems unresolved. A city can become easier to market before it becomes easier to live in for everyone.
No. They can be accurate within their own design. The problem starts when a ranking built for one purpose, such as expatriate assignment policy or editorial comparison, is treated as a full measure of resident well-being or urban fairness.
The main categories used by major rankings reward stability, healthcare quality, infrastructure, and service reliability. Those strengths are more common in cities with strong fiscal capacity, long investment cycles, and national institutional support.
Sometimes in specific domains, yes. UN-Habitat’s 2025 pilot shows that a city such as Kampala can score strongly in health without appearing near the top of commercial or editorial lists. That does not prove it would rank highly overall under every method, but it does show how much depends on the framework.
None should be used alone. Policymakers need domain-level measures that include affordability, inequality, access, service distribution, and local perceptions. A single global rank is better for publicity than for governing.
The clearest evidence is in the design brief. Mercer states that its ranking is for international assignees. EIU measures standardized lifestyle conditions across cities. Those choices tilt results toward wealthy, stable, infrastructure-rich places before any final score is calculated.
Used carefully, liveability rankings can describe parts of urban performance. Used carelessly, they turn wealthy-city advantages into universal standards and leave too much of city life outside the frame. The bias is not a conspiracy. It is structural, built into the questions each system was designed to answer. The most useful question is not simply which city came first, but which residents the metric was built to see.