Physical Address
304 North Cardinal St.
Dorchester Center, MA 02124
Physical Address
304 North Cardinal St.
Dorchester Center, MA 02124

London and New York sit at the top of GaWC’s 2024 world city classification, where the measure is network connectivity through 175 advanced producer service firms across 785 cities, according to GaWC’s 2024 methodology. Kearney’s 2025 Global Cities Index also places New York and London first and second, but that ranking draws on 31 indicators across five dimensions and a sample of only 158 cities, according to Kearney’s 2025 report.
The disagreement is not a data error. It is a design choice. Global city rankings look authoritative because they produce a single ordered list, but each list is built on decisions about what counts as urban success, which places enter the sample, how indicators are weighted, and which time horizon matters. Those are governance choices as much as research choices, because city leaders, investors, and media outlets often use the results to justify policy priorities and competitive narratives.
Core methodological differences across five major ranking systems:
Different rankings answer different questions. Oxford Economics measures broad urban performance across a large universe. GaWC measures position in a producer-services network. Kearney splits present strength from future readiness. GFCI focuses on financial-centre competitiveness rather than city performance as a whole.
That matters in public decision-making because the headline rank travels farther than the method. Once a mayor’s office, chamber of commerce, or investment agency cites a list, the publisher’s definition of value can start to shape local priorities, even if the ranking was never designed for that purpose.
The disagreement becomes clearer when the same city is placed side by side across different systems.
This is not inconsistency. It is measurement design in action.
Global city rankings are composite systems that compress many urban traits into one score or tier. Some are broad, like Oxford Economics’ Global Cities Index 2024, which covers 1,000 cities and scores them across economics, human capital, quality of life, environment, and governance using 27 indicators, according to Oxford Economics’ index overview. Others are narrower by design. GaWC classifies cities by their role in corporate service networks, not by livability or municipal management, according to Loughborough’s 2024 release.
These rankings matter because they are used as shorthand in settings that reach beyond branding. Economic development agencies cite them in investment pitches. National and city governments reference them in strategy documents. Media outlets reuse the results as comparative facts. The problem is not that rankings exist.
The problem is that a single ordinal list can hide the political and technical decisions underneath. If one index rewards global headquarters, another rewards future capacity, and a third rewards urban magnetism for talent and visitors, disagreement is expected. It is built into the model.
Oxford Economics starts from breadth. Its published framework covers the world’s 1,000 largest cities, which it says accounted for 60 percent of global GDP and more than 30 percent of global population in 2023, according to the methodology page. That creates a universe where very large metropolitan economies are visible even if they are not elite command centres in global finance or law. It also gives governance, environment, and quality of life direct weight in the final score.
GaWC takes the opposite approach. It focuses on a narrower set of cities but measures them through a specific lens: the connectivity of advanced producer service firms. The 2024 classification draws on 175 leading firms across 785 cities, generating 137,375 data points, according to GaWC’s methodology page. A city’s rank reflects how tightly it is woven into global law, accounting, consulting, and financial networks, not how many residents it has or how livable it is.
Kearney’s 2025 Global Cities Index covers 158 cities using 31 indicators across five dimensions (business activity, human capital, information exchange, cultural experience, and political engagement), according to the 2025 report. This middle ground between breadth and specialization produces a different top tier than either Oxford Economics or GaWC alone.
No single ranking is universally “correct.” Each is valid within its own framework.
The better question is: what are you trying to measure?
The mistake is not using rankings. It is using the wrong one for the question.
A ranking system decides three things before any city is scored: the city universe, the indicators, and the weighting. Those are not neutral housekeeping steps. They are the architecture of the result. The Mori Memorial Foundation’s Global Power City Index 2025 limits itself to 48 target cities and applies 72 indicators across economy, research and development, cultural interaction, livability, environment, and accessibility, according to the official summary. A city excluded from that list cannot rise through performance. It is absent before the contest begins.
The same principle applies to indicator choice. GFCI, updated twice yearly in March and September, focuses exclusively on financial-centre competitiveness, according to the March 2025 report. A city that excels in livability or innovation but lacks deep financial markets will not rank highly, not because it failed, but because the index does not measure those traits.
There is no single agreed definition of a global city. The term has been stretched to cover command and control functions, quality of life, urban attractiveness, innovation capacity, financial clout, demographic scale, and future growth prospects. Once the concept broadens that far, method choices become contests over what counts. Kearney formalizes this by publishing two separate rankings in the same report, one for current standing and another for outlook, according to its 2025 methodology section.
In the 2025 Global Cities Outlook, Munich ranks first, Seoul second, and Singapore third, according to Kearney’s outlook tables. These cities score higher on variables like demographic dynamism, infrastructure investment, and innovation readiness than on current global command functions. The same publisher’s current-state index puts New York and London at the top. Same data source. Different winners because the question changed.
One of the least visible issues is territorial definition. Many rankings say “city” in the headline, but the underlying unit may be a municipality, a metropolitan economy, or a functional urban region. The source pack for these rankings makes clear that city boundary definitions are not standardized and are not always explained in top-level summaries. That weakens one-to-one comparison before any scoring begins.
A city’s rank can shift depending on whether the boundary includes only the central business district, the metropolitan area, or the wider commuter shed. Rankings that use municipal boundaries favour compact cities. Those that use metropolitan areas favour sprawling regions with large suburban populations. Neither approach is wrong, but the choice reshapes the result in ways that rarely appear in the headline figure.
City governments are the most obvious audience, but they are not the only one. Economic development teams use rankings in investment promotion. Universities and tourism boards use them in international positioning. Large employers use them in location strategy. Journalists use them as shorthand. Residents encounter them when local officials claim that a city is “rising” or “falling” in the world. The effect is strongest in places already competing for talent, capital, or headquarters functions.
The geographic scope is uneven. A global ranking may boost the image of a central business district while saying little about outer districts where most residents live. In Munich, Kearney’s 2025 Global Cities Outlook first-place finish speaks to future potential within Kearney’s framework, according to the report’s outlook tables. That does not tell a commuter in a peripheral municipality whether service levels improved this year. In Seoul and Copenhagen, which also rank high in that outlook, the same issue applies. The ranking can help frame a city-region’s reputation, but it can blur which neighborhoods or groups are gaining from the conditions being rewarded.
There is also a selective-use problem. Officials can cite the list where they perform well and ignore the list where they do not. Residents and local opposition groups often lack the time or access to unpack the methodology. That asymmetry gives ranked indicators political force even when they are only partial descriptions.
Sector rankings make the divergence visible. GFCI is a ranking of financial centres, updated in March and September, according to the index report. It is designed to tell readers about competitiveness in financial services. A city can perform well there and still face weaker scores in governance, environmental quality, or social conditions in a broader index. That is not contradiction. It is specialization.
London and New York rank highly in GFCI because they host the largest concentrations of financial firms and trading volume. A city that ranks lower in finance might rank higher in a livability index or an innovation index. The rankings are not competing to find the “best” city. They are answering different questions about urban function.
The clearest comparison is inside Kearney’s own 2025 Global Cities Report. Its current-state index puts New York, London, and Paris at the top, while its outlook ranks Munich first, Seoul second, Singapore third, San Francisco fourth, and Copenhagen fifth, according to the report’s two league tables. Same publisher. Different question. Different winners.
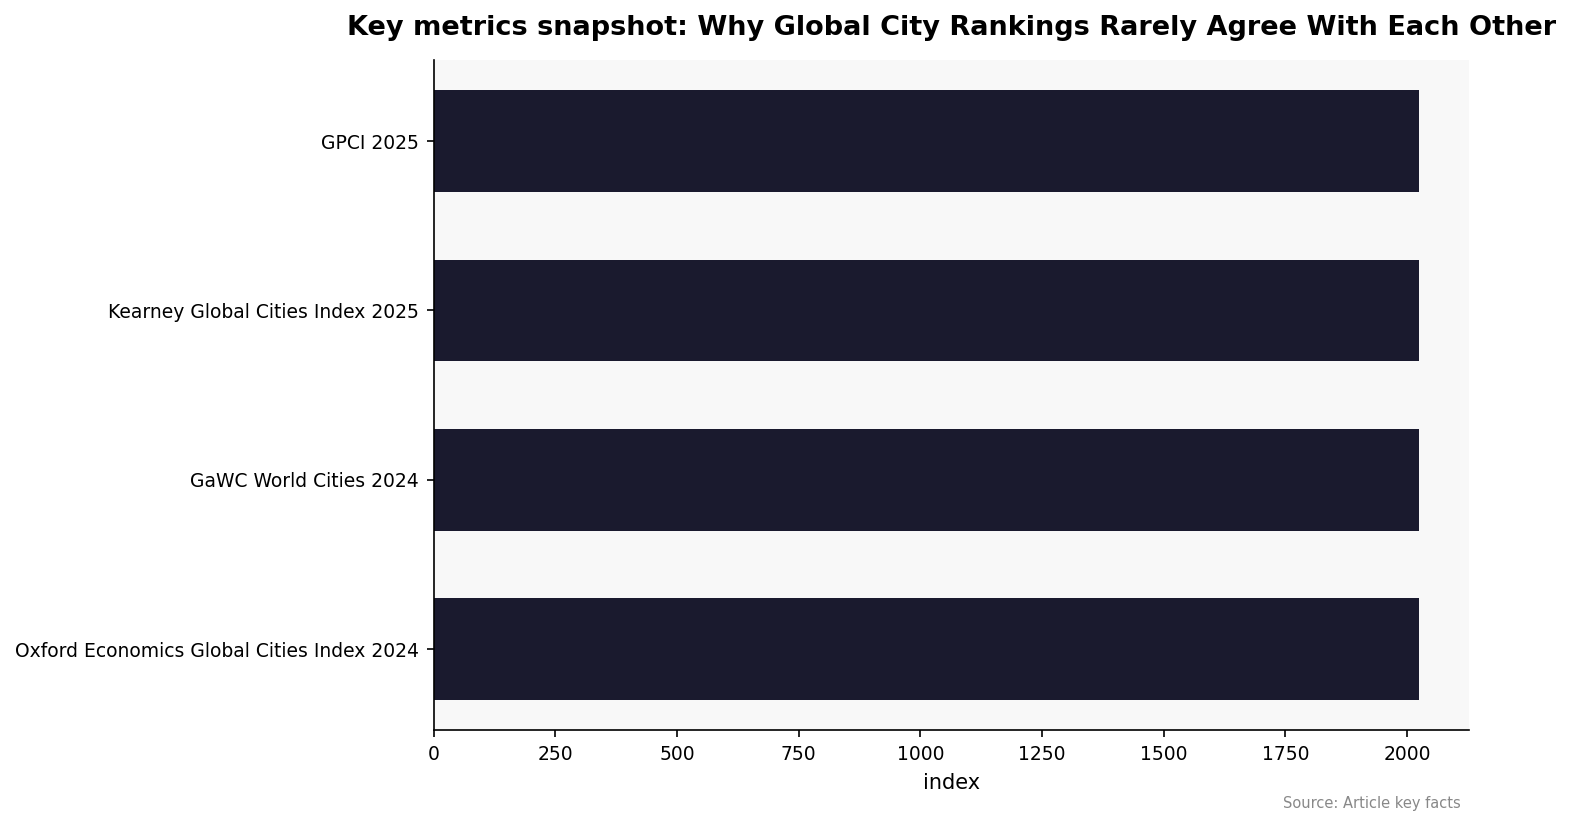
| Ranking | City universe | Main method | Update rhythm |
|---|---|---|---|
| Oxford Economics Global Cities Index 2024 | 1,000 cities | 27 indicators across 5 categories | Periodic published edition |
| GaWC World Cities 2024 | 785 cities | 175 firms and network connectivity | Research release cycle |
| Kearney Global Cities Index 2025 | 158 cities | 31 indicators across 5 dimensions | Annual report |
| GPCI 2025 | 48 cities | 72 indicators across 6 functions | Annual since 2008 |
Method transparency varies. Oxford Economics, GaWC, Kearney and Mori all publish meaningful methodology detail in public-facing material. Mori’s GPCI 2025 says the ranking is reviewed by external experts and includes third-party peer reviewers, according to the summary document. Useful, but that still does not remove the judgment embedded in choosing functions, indicators and weights.
Other widely circulated rankings are harder to audit from public materials alone. The research pack for this article did not verify a clean primary-source methodology page for the EIU Global Liveability Index 2025. That does not invalidate the ranking. It does mean comparisons with better-documented systems should be cautious. A city official quoting one rank against another should be able to answer basic questions about coverage, data windows, and geographic unit. Often they cannot.
Transparency is not the same as neutrality. A fully documented ranking can still privilege one model of urban success over another. Good governance is not about finding the perfect list. It is about knowing what a list can and cannot tell you before it enters policy debate.
City halls are unlikely to stop citing rankings. The incentives run the other way. A climb in any well-known table offers a clean story for investors and local media. What may change is how these tools are read. More cities now publish their own indicator dashboards, and a stronger local evidence base can reduce dependence on external league tables.
The better use of rankings is narrower. Treat them as comparative prompts. If Singapore scores highly on accessibility in one system, the useful follow-up is not civic chest-beating. It is a method check: what indicator produced that result, and whether it is measuring airport connectivity, transit reach, or international business access. If Copenhagen rises in a future-oriented table, the useful question is which variables moved and whether they are under local control.
Used this way, rankings can still inform strategy. Used as universal verdicts, they distort it. The strongest city leaders will read the footnotes before they quote the headline.
The biggest error is treating a ranking as a universal verdict rather than a specialized measurement.
A city ranked highly for finance may still struggle with housing or environmental quality. A city ranked highly for livability may not function as a global business hub.
When rankings are quoted without context, they stop informing decisions and start distorting them.
Why do London and New York rank high in so many systems?
They perform strongly on several dimensions at once, especially global business connectivity and institutional depth. But even here, the reason matters. In GaWC, their position comes from advanced producer service networks. In Kearney, it comes from a broader mix of business activity, information exchange, culture, and political engagement.
Does a higher-ranked city automatically have better governance?
No. Some rankings include governance as one component. Others do not measure it directly at all. A high rank may reflect finance, connectivity, research strength, or cultural pull rather than administrative quality.
Why can Munich rank first in one list and not appear at the top of another?
Kearney’s 2025 Global Cities Outlook measures future potential, not current global command functions. A city can look strong in future-oriented variables and still sit below larger, more internationally central cities in present-day connectivity rankings.
Are city rankings still useful?
Yes, if they are read as specialized tools. They can help compare certain functions across cities. They are less useful when treated as a single definitive verdict on urban success.
What is the first thing to check before citing a ranking?
Check the unit of analysis and the method. If the ranking uses a metropolitan economy, a municipal boundary, or a sector-only lens, that changes what the result can legitimately say.