Physical Address
304 North Cardinal St.
Dorchester Center, MA 02124
Physical Address
304 North Cardinal St.
Dorchester Center, MA 02124

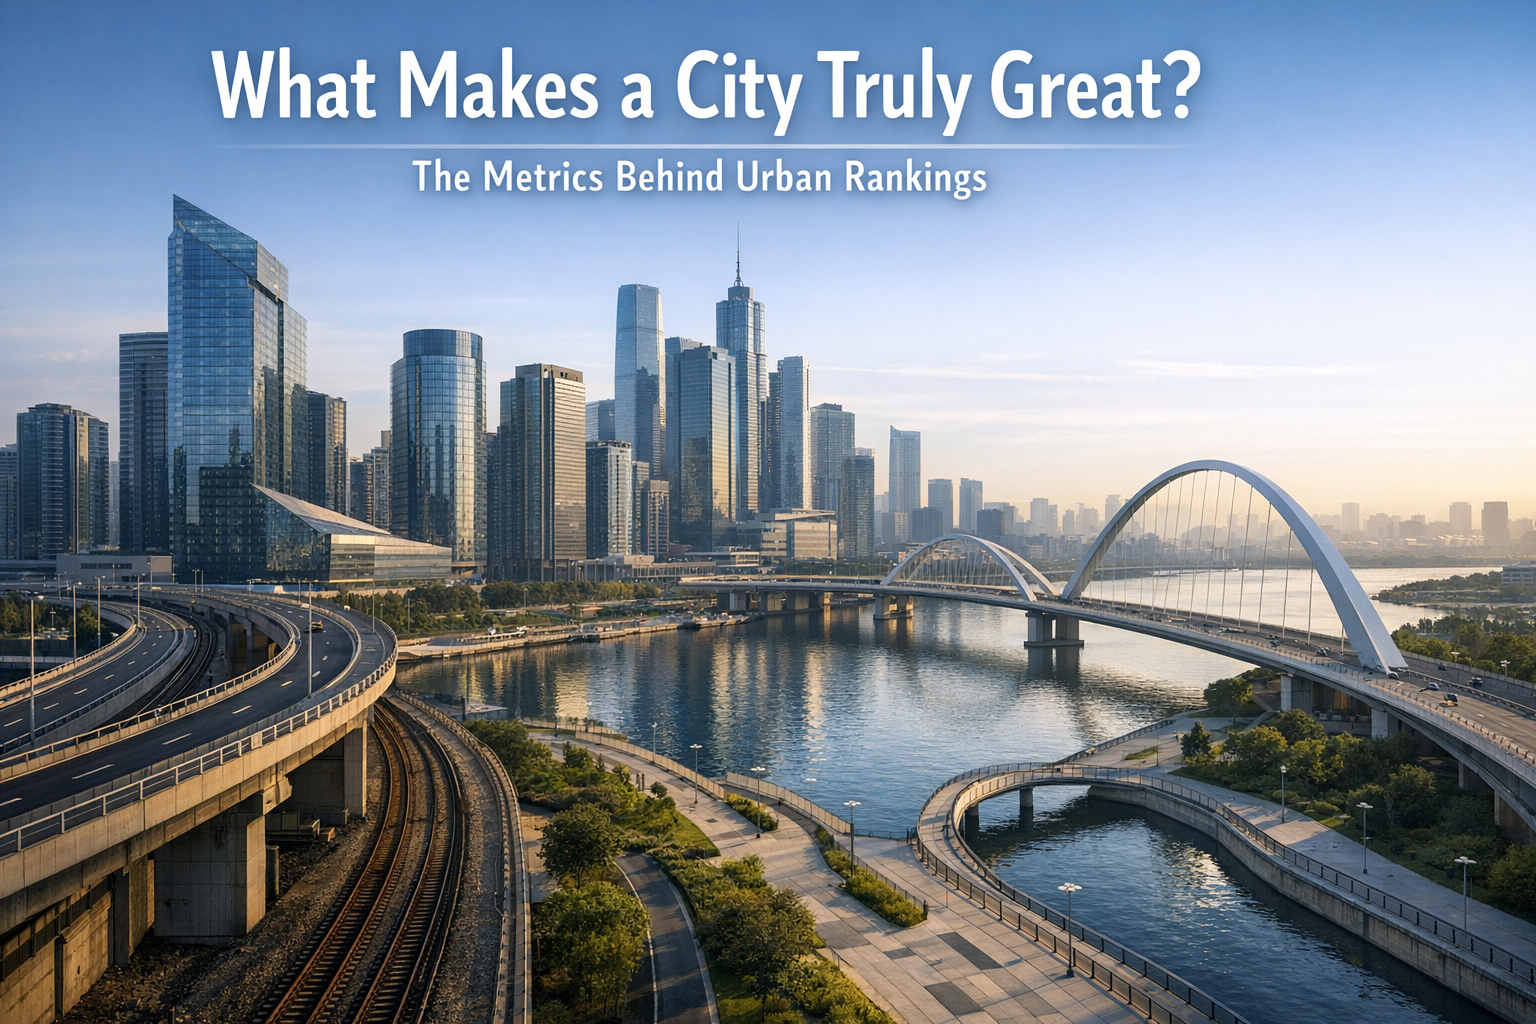
Six major indices claim to measure urban greatness, but they do not measure the same thing. They cover different cities, weight different factors, and reach different conclusions. The gap between them is not a flaw in the data. It is the point.
Global city rankings are cited constantly in 2025, from government reports to investment pitches and media headlines. Cities are described as “top-ranked,” “most liveable,” or “fastest rising” without explaining what those rankings actually measure. Understanding how these indices work is essential if they are going to be used to justify real-world decisions.
City rankings are constructed arguments about what cities are for. The Oxford Economics Global Cities Index 2024 measures economic scale across 1,000 cities using 27 indicators. The Economist Intelligence Unit Global Liveability Index 2025 weights resident conditions, with stability and culture/environment at 25% each. The Mori Memorial Foundation Global Power City Index 2025 evaluates only 48 cities across 70 indicators, prioritizing global influence.
The IMD Smart City Index 2025 incorporates citizen surveys, finding that 110 of 146 cities identified affordable housing as a priority. UN-Habitat’s City Prosperity Initiative has covered more than 300 cities with a framework treating governance and equity as measurable dimensions. The OECD’s regional well-being tools cover over 225,000 municipalities across 41 countries and warn that cross-city comparisons can mislead when administrative boundaries differ. These are not competing answers to the same question. They are different questions about what cities are for.
City rankings are composite indices. They assign numerical scores to urban areas by aggregating multiple indicators, usually grouped into weighted categories. The resulting score allows cities to be ordered, compared, and benchmarked against one another over time. Governments, investors, planning agencies, and media outlets use these scores to allocate attention, justify policy, and attract capital.
Three broad models dominate. Liveability models, led by the Economist Intelligence Unit, focus on conditions experienced by residents: stability, healthcare access, cultural infrastructure, and transport quality. Competitiveness or power models, including the Oxford Economics Global Cities Index and the Mori Memorial Foundation’s Global Power City Index, emphasize economic scale, global connectivity, and the capacity to attract internationally mobile workers and firms.
Citizen-experience or smart-city models, most prominently the IMD Smart City Index, incorporate survey responses from residents alongside hard data, introducing a different kind of evidence: what people say about where they live, not only what administrative records show.
Intergovernmental frameworks from the OECD and UN-Habitat operate differently. They are not media rankings but analytical tools designed to inform policy at scale, with explicit attention to measurement consistency, governance quality, and distributional outcomes. Their scope and methodology differ substantially from commercial indices.
The Mori Memorial Foundation Global Power City Index evaluates 48 cities using 70 indicators organized under six functions: Economy, Research and Development, Cultural Interaction, Livability, Environment, and Accessibility. The framework is explicit about its purpose. It measures a city’s capacity to attract and retain creative people and global enterprises, not to deliver comfortable everyday conditions for the majority of residents.
That distinction matters for planners and policymakers who cite Global Power City Index scores as evidence of urban success. A city can rank highly on Economy and Accessibility while performing poorly on housing affordability or environmental quality, because those outcomes are not weighted equally in the model.
The index’s 48-city scope also concentrates attention on already globally prominent cities, which means it tells you relatively little about the urban conditions facing most of the world’s city-dwelling population. The yearbook includes indicator definitions and source lists, giving it reasonable methodological transparency, but the “power” framing embeds a specific theory of what cities are for, one that privileges international influence over local equity.
Planners who use Global Power City Index data to argue for infrastructure investment or zoning changes are making an implicit argument. That argument should be visible, not buried in a citation.
The Economist Intelligence Unit Global Liveability Index 2025 evaluates cities across five categories using over 30 qualitative and quantitative factors. Category weights, as documented in the methodology sample from December 2020 and treated here as historical context, break down as follows: stability 25%, healthcare 20%, culture and environment 25%, education 10%, and infrastructure 20%.
The current 2025 campaign page confirms the five-category structure, but the most granular public breakdown of factor definitions remains the 2020 document.
The weighting scheme has practical consequences. Stability, which includes assessments of terrorism risk, conflict, and crime, carries the same weight as culture and environment combined. A city with strong public transport and accessible healthcare but elevated political instability will score lower than one with weaker services but greater perceived security.
For cities in the Global South, or cities navigating post-conflict recovery, this structure can suppress scores in ways that do not reflect resident well-being in full. Infrastructure carries 20% of the total score, covering road network quality and public transport quality, both directly shaped by planning decisions. Education, at 10%, has the lowest weight of any category, a choice that reflects the index’s focus on current living conditions rather than long-run human development.
The scope differences across indices are large enough to change which cities appear in the conversation at all. Oxford Economics covers 1,000 cities. UN-Habitat’s City Prosperity Initiative has reached more than 300 cities. The IMD Smart City Index 2025 measured 146 cities. The Mori Memorial Foundation Global Power City Index covers only 48. These are not variations on the same measurement. They are different answers to the question of which cities are worth measuring.
| Index | Publisher | Cities covered | Primary frame |
|---|---|---|---|
| Global Cities Index 2024 | Oxford Economics | 1,000 | Economic scale and global integration |
| Global Power City Index 2025 | Mori Memorial Foundation | 48 | Global influence and talent attraction |
| Global Liveability Index 2025 | Economist Intelligence Unit | Not publicly specified | Resident living conditions |
| Smart City Index 2025 | IMD | 146 | Citizen perception and technology |
| City Prosperity Initiative | UN-Habitat | 300+ | Inclusive prosperity and governance |
| Regional Well-Being Tool | OECD | 225,000+ municipalities | Multidimensional well-being, policy use |
The disagreement becomes easier to see when the same types of cities repeatedly perform well for different reasons. A power index, a liveability index, and a prosperity framework do not reward the same urban strengths.
The important point is not that one list is right and the others are wrong. It is that each framework rewards a different idea of urban success.
The OECD’s position on city boundaries is not a technical footnote. It is a challenge to the validity of most cross-city comparisons. When Oxford Economics reports that the 1,000 largest cities accounted for 60% of global GDP and over 30% of the world’s population in 2023, the meaning of that figure depends entirely on how “city” is defined. A city measured at its administrative boundary may include only the dense urban core.
The same city measured as a functional urban area, the continuous built-up zone and its economically integrated surroundings, can be two to five times larger in both population and output.
This distinction shapes how planners interpret ranking data. A city that appears to underperform on economic output may actually be measured at a narrower boundary than a competitor.
The OECD’s Local Data Portal covers over 225,000 municipalities and is built around consistent geographic units. Most headline rankings are not, which means their cross-city comparisons can mislead if the underlying boundary definitions are not checked against primary sources.
High ranking scores carry real-world consequences. Cities that place well in the Economist Intelligence Unit liveability index or the Oxford Economics Global Cities Index attract foreign direct investment, international talent recruitment campaigns, and tourism promotion budgets.
Municipal governments treat strong rankings as policy validation and use them in budget arguments, development pitches, and intergovernmental negotiations. The incentive to optimize for ranking criteria, rather than for underlying resident outcomes, is genuine.
This creates a secondary effect. Indices that weight certain outcomes more heavily shape which urban problems receive policy attention and which remain invisible. When the Economist Intelligence Unit weights stability at 25%, cities in regions with political volatility face structural disadvantages in attracting investment, regardless of their actual service quality or resident satisfaction.
When the Mori Memorial Foundation emphasizes global connectivity and talent attraction, smaller cities and cities in the Global South are undervalued, even if they deliver strong outcomes on housing, equity, or environmental quality.
The IMD Smart City Index 2025 found that 110 of 146 cities identified affordable housing as a priority in resident surveys. Yet most major indices do not measure housing affordability directly. The Economist Intelligence Unit index includes housing in its infrastructure category, but as one factor among many. The Oxford Economics Global Cities Index does not include housing affordability at all. This gap between what residents say matters and what indices measure is not accidental. It reflects the priorities of the organizations that commission and publish the rankings.
The UN-Habitat City Prosperity Initiative takes a different approach. It treats governance quality, equity, and environmental sustainability as core dimensions, not optional add-ons. The OECD’s regional well-being framework covers 11 well-being dimensions across over 225,000 municipalities, including work-life balance, civic engagement, and environmental quality.
These frameworks receive less media coverage than the Economist Intelligence Unit or Oxford Economics rankings, but they offer a more complete picture of what makes cities work for residents.
Named city examples make the methodological gap clearer. Vienna can perform extremely well in liveability rankings because stability, public services, and infrastructure are weighted heavily, while it is less central in power-oriented indices that emphasize global influence and corporate reach.
New York and London tend to dominate power frameworks because of finance, connectivity, and institutional concentration, even though they face serious affordability and inequality pressures that make them less comfortable as everyday resident environments.
Singapore often performs strongly in power, connectivity, and smart-city frameworks because it combines high state capacity, trade integration, and efficient administration, while still facing cost pressures that can weaken liveability sub-scores.
Copenhagen and Zurich often benefit when indices emphasize quality of life, environmental conditions, or public-service reliability. These are not contradictions in the data. They are consequences of different weighting choices.
City rankings shape real decisions.
City rankings are routinely used in policy and investment decisions. Municipal governments cite liveability scores in budget debates, while developers and investors use global city rankings to support location choices. These rankings often function as shorthand for urban success, even when they measure only a narrow set of outcomes.
It measures only what its creators chose to measure. A city can score well on liveability while failing on affordability. It can rank high on economic power while delivering poor outcomes on environmental quality or equity.
For residents, the consequence is that city policy may optimize for metrics rather than for lived experience. For investors, ranking-driven decisions can miss emerging risks or opportunities that the index does not capture. For planners, citing a ranking without checking its methodology and scope can produce policy choices that serve the index’s priorities, not the city’s.
Some cities recur across multiple systems, though not always for the same reasons. Singapore, Zurich, London, New York, Tokyo, and Copenhagen tend to appear repeatedly because they combine several strengths at once: economic relevance, institutional capacity, infrastructure quality, or strong resident conditions.But repeated appearance does not mean the rankings agree on what those cities are best at. One framework may reward connectivity and capital flows, while another rewards safety, healthcare, or environmental performance.
That is why a city can look consistently strong across the ranking ecosystem while still carrying very different strengths and weaknesses depending on the index being cited.