Physical Address
304 North Cardinal St.
Dorchester Center, MA 02124
Physical Address
304 North Cardinal St.
Dorchester Center, MA 02124

For years, Amsterdam has been treated as the global gold standard for cycling. The 2025 Copenhagenize Index challenges that assumption. Copenhagen did not just edge ahead. It beat Amsterdam on the parts of cycling that cities can control: infrastructure quality, policy strength, and system management. The result raises a sharper question than the ranking itself: is Amsterdam still the best cycling city, or has it been overtaken by a more disciplined model?
Copenhagen ranked 2nd and Amsterdam 4th in the 2025 Copenhagenize Index, a gap driven less by bike culture than by how each city manages its network. Utrecht placed first, which matters because this is not a claim that Copenhagen is the world leader on every cycling measure. It is a narrower point about why one mature cycling city is now scoring above another.
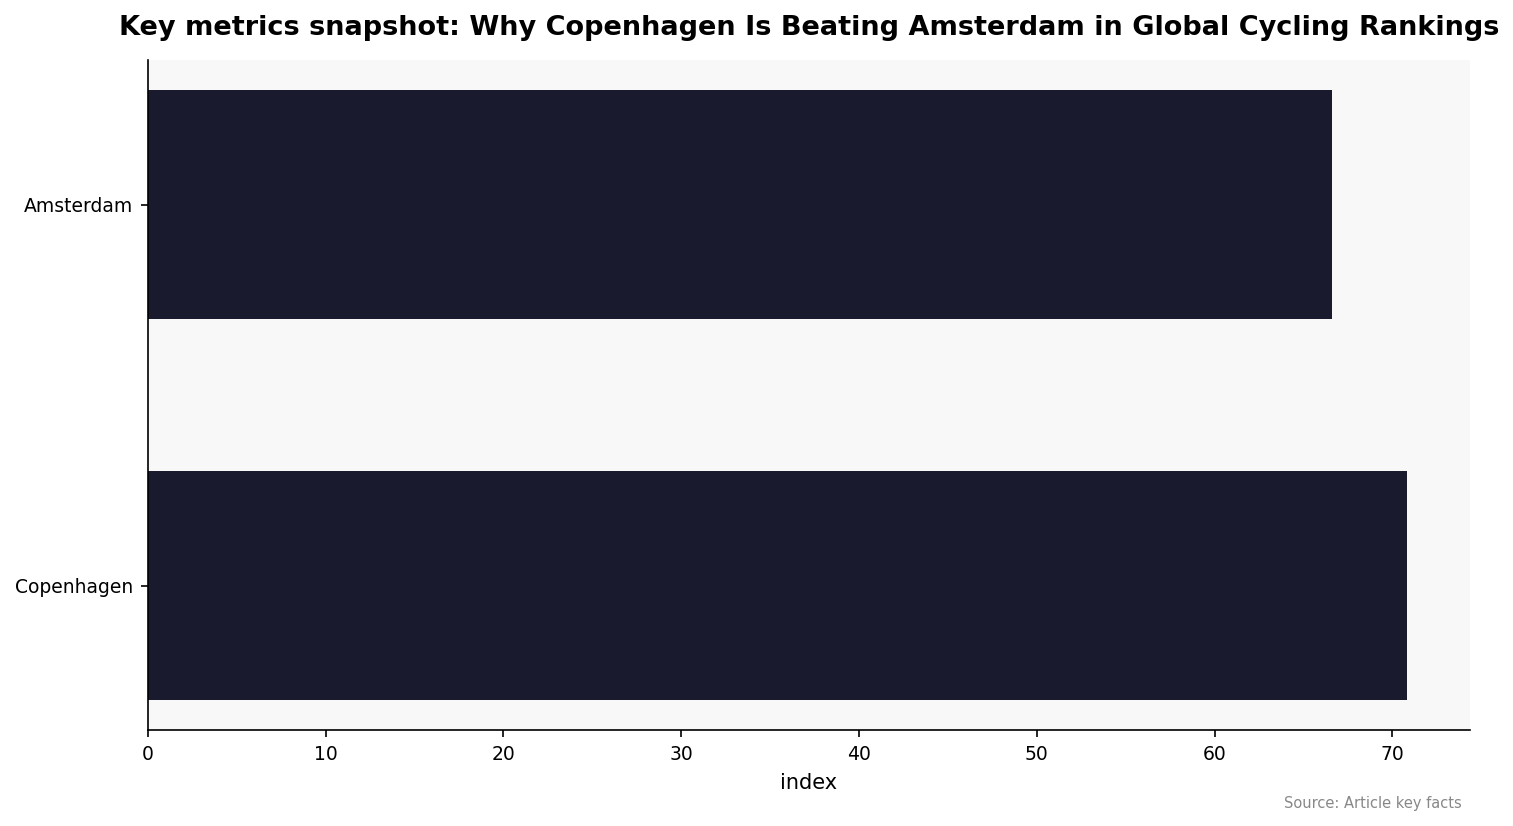
The split inside the ranking is the useful part. Amsterdam actually scored slightly higher on Usage and Reach, 66.5 versus 65.2, but Copenhagen opened a bigger lead on Safe and Connected Infrastructure, 73.8 versus 68.7, and a much bigger one on Policy and Support, 76.6 versus 62.4. That pattern suggests a system question, not a participation question. High ridership still matters. It just does not settle the ranking on its own.
The 2025 ranking result turns on a specific angle. Copenhagen scored above Amsterdam because it combines dense protected infrastructure with 52 km of protected bicycle lanes per 100 km of roadway, explicit city targets, and operating changes such as corridor signal coordination, rather than relying on long-established cycling habits alone.
Amsterdam remains one of the world’s strongest bike cities, but the 2025 ranking suggests its system is starting to show strain under its own success. The current evidence points to something narrower and more useful for planners: heavy usage without matching policy discipline can turn success into strain, especially when safety perception and parking systems start to lag behind demand.
The headline change is simple. Copenhagen sits above Amsterdam in the latest influential international ranking, and the margin is large enough to examine rather than dismiss as noise. Copenhagen scored 70.8 overall versus Amsterdam’s 66.6 in the 2025 Copenhagenize Index, according to the index scoring document. Copenhagen leads on infrastructure quality with 73.8 versus 68.7 for Amsterdam, and on policy support with 76.6 versus 62.4. Amsterdam’s slight lead on usage shows the ranking is not punishing low adoption. It is rewarding stronger network conditions around that adoption.
That distinction matters because Amsterdam’s international image still rests on sheer bike volume and everyday visibility. The ranking method used by EIT Urban Mobility is broader. It looks at whether cycle routes are safe and connected, whether cycling is widely used, and whether policy gives the mode durable institutional support. On that basis, Copenhagen is ahead. Utrecht’s first-place finish also sharpens the point. This is not a two-city popularity contest. It is a measurement of mature cycling systems, and Copenhagen currently performs better than Amsterdam on the system variables that can be planned and managed.
For daily riders, the difference is less about whether a bike trip is possible and more about whether the trip remains legible, protected, and predictable at city scale. Copenhagen’s edge suggests that route continuity and network operations now matter as much as simple network presence. The Guardian reported in September 2025 that Copenhagen has coordinated “green wave” signals for cyclists on key corridors, allowing riders to hit successive green lights at cycling speed on major routes such as Nørrebrogade, which improves travel time and ride quality without requiring a wholly new network, according to this report.
Global cycling rankings do not measure a single thing. They aggregate several features that cities often develop at different speeds. The Copenhagenize Index groups performance into Safe and Connected Infrastructure, Usage and Reach, and Policy and Support, as explained by EIT Urban Mobility in the 2025 release. That means a city can attract high ridership because cycling has deep social acceptance, yet still lose points if riders face fragmented protection, weak traffic calming, or less coherent policy backing.
That structure is useful in the Copenhagen and Amsterdam comparison because it separates use from governance. A city with strong bike culture is not automatically the city with the strongest bike system. The 2025 scores show exactly that. Amsterdam slightly leads on usage at 66.5 versus Copenhagen’s 65.2, but Copenhagen is ahead on the two categories that depend more directly on public decisions: how space is protected, how streets are managed, and whether the city has adopted measurable goals. The story is about institutional performance. It is not about whether one city has discovered cycling and the other has not.
Copenhagen’s standout infrastructure metric is the one the ranking makes most explicit. The city has 52 km of protected bicycle lanes per 100 km of roadway, which the EIT release described as the highest density in the world when announcing the results. That number does not say everything about a network, but it does say something concrete about how often separation is available rather than exceptional. It helps explain why Copenhagen scored 73.8 on infrastructure.
The easiest mistake is to read Copenhagen’s higher rank as proof that more people cycle there. The current source pack does not support that claim. What it does show is narrower. Copenhagen reported that 45% of trips to work and educational institutions were by bicycle in 2023, up from 42% in 2020, with a target of 50% by the end of 2025 in the city note. That is a strong commuting figure. It is also tied to an official target, which matters for the policy score.
The ranking gap matters most for daily commuters, school and university riders, delivery workers, and street managers in the dense central districts where cycling volumes are highest. In Copenhagen, the city’s own target is directed at trips to work and education, which means the performance test sits squarely on weekday corridor reliability rather than leisure cycling, according to the 2025 target note. In Amsterdam, the pressure falls hardest on riders using crowded central routes and on neighborhoods around major stations where parking demand spills into public space.
The station examples are concrete. Amsterdam Bike City said riders gave high parking scores at guarded facilities such as Noord metro station, Amstel station, De Hallen, and Central Station, which suggests the city can produce better outcomes where parking supply and management are concentrated, according to the English summary. The weaker points are the places between those nodes, mixed-traffic streets under new 30 km/h rules, crowded cycle tracks, and curb space where bikes are removed to the depot. Residents benefit from dense cycling cities. They also absorb the operational mess when those systems are under-managed.
Amsterdam’s own data shows the pressure clearly. The statement “I feel safe during this ride” fell from 7.4 in 2021 to 7.1 in 2023, even as overall ride ratings improved to 7.3 out of 10, according to the municipal summary published in March 2024. That is a useful warning sign. A network can remain widely used and broadly liked while producing lower perceived safety. In a ranking that rewards policy support, that kind of metric matters because it implies unresolved street design or operating issues.
Bike rankings often understate parking management, but Amsterdam’s numbers are large enough to matter. The city said about 70,000 bicycles were taken to the municipal depot in 2023, up from 63,000 in 2022, and expected to rise to 80,000 in 2024, according to the December 2024 report. Less than 30% are collected by owners, and handling costs the city about €40 per bicycle. That is an operational burden, not a side issue.
Parking overload changes how a cycling city works. It consumes enforcement time, crowds station areas, and turns curb management into a continuous removal cycle. It also points to a mismatch between network success and street capacity for bike storage. Copenhagen’s edge in policy support should be read partly through this lens. A bike system is not only lanes and signals. It is also parking, depot capacity, and the rules that keep public space usable. Amsterdam remains a high-performing cycle city, but these numbers show a city handling volume at the back end rather than absorbing it cleanly in the street network.
The cleanest comparison is inside the 2025 ranking itself.
| City | Overall | Infrastructure | Usage and Reach | Policy and Support |
|---|---|---|---|---|
| Copenhagen | 70.8 | 73.8 | 65.2 | 76.6 |
| Amsterdam | 66.6 | 68.7 | 66.5 | 62.4 |
Utrecht’s first-place position is the reminder that neither city owns the field. It also supports a broader reading of northern European bike policy. The top group is no longer won by image alone. It is being won by cities that pair heavy ridership with disciplined street design and formal policy machinery. That pattern has relevance beyond the Netherlands and Denmark. Paris has moved quickly by converting street space at scale, and Brussels used broad 30 km/h rules to shift safety conditions citywide. Copenhagen’s current advantage fits that same managerial logic. Amsterdam’s usage lead in the index means its demand base is still elite. The weaker policy score suggests the city is not extracting the same ranking benefit from it.
Copenhagen’s near-term test is clear. The city set an end-2025 target for cycling to reach 50% of trips to work and educational institutions, up from 45% in 2023, according to the official target document. If that number is met or approached in the next reporting cycle, the city’s current ranking logic strengthens. It would mean Copenhagen is not only scoring well on policy design but converting it into more commute trips by bike.
Amsterdam’s short-term path is different. The city introduced a 30 km/h speed limit on many streets in December 2023 and has evidence that riders want safer, less stressful conditions. If that program reduces casualty risk and improves safety perception, Amsterdam’s policy score could rise in future rankings. Parking management is the other likely pressure point. Without better station-area storage and less conflict on busy routes, the city risks remaining a place with exceptional cycling demand but a more visibly strained operating system. Rankings can shift. Right now Copenhagen is getting more credit because it is supplying more order.
The current evidence suggests Copenhagen’s lead is largely deserved on the criteria the index actually measures. The largest gaps are in areas directly shaped by public decisions: protected infrastructure density, network continuity, and policy support. These are not perception-based metrics.
However, the result is still open to debate because Amsterdam remains one of the highest-usage cycling cities in the world. The index gives less weight to cultural normalization and everyday cycling volume than to system management. That means the ranking favors cities that are actively refining their networks over those that built strong cycling cultures earlier.
In simple terms, Amsterdam still represents peak cycling adoption, while Copenhagen currently represents peak cycling system design. The ranking rewards the latter more heavily in 2025.
Did Copenhagen rank first in the world?
No. Utrecht ranked 1st in the 2025 Copenhagenize Index. Copenhagen ranked 2nd and Amsterdam ranked 4th.
Is Amsterdam losing cyclists?
The source pack does not show that. Amsterdam scored slightly higher than Copenhagen on the index’s Usage and Reach pillar, and municipal survey data still shows strong rider satisfaction.
What is the biggest reason Copenhagen scored higher?
The largest gap is in Policy and Support, where Copenhagen scored 76.6 and Amsterdam 62.4. Copenhagen also led on Safe and Connected Infrastructure.
Does this mean Amsterdam has poor cycling infrastructure?
No. Amsterdam remains one of the world’s top cycling cities. The evidence here shows relative pressure points, not system failure.
What should readers watch next?
Two items. Copenhagen’s next reporting on whether it reached its end-2025 50% commute and education trip target, and Amsterdam’s results from its 30 km/h program and parking management efforts.