Physical Address
304 North Cardinal St.
Dorchester Center, MA 02124
Physical Address
304 North Cardinal St.
Dorchester Center, MA 02124

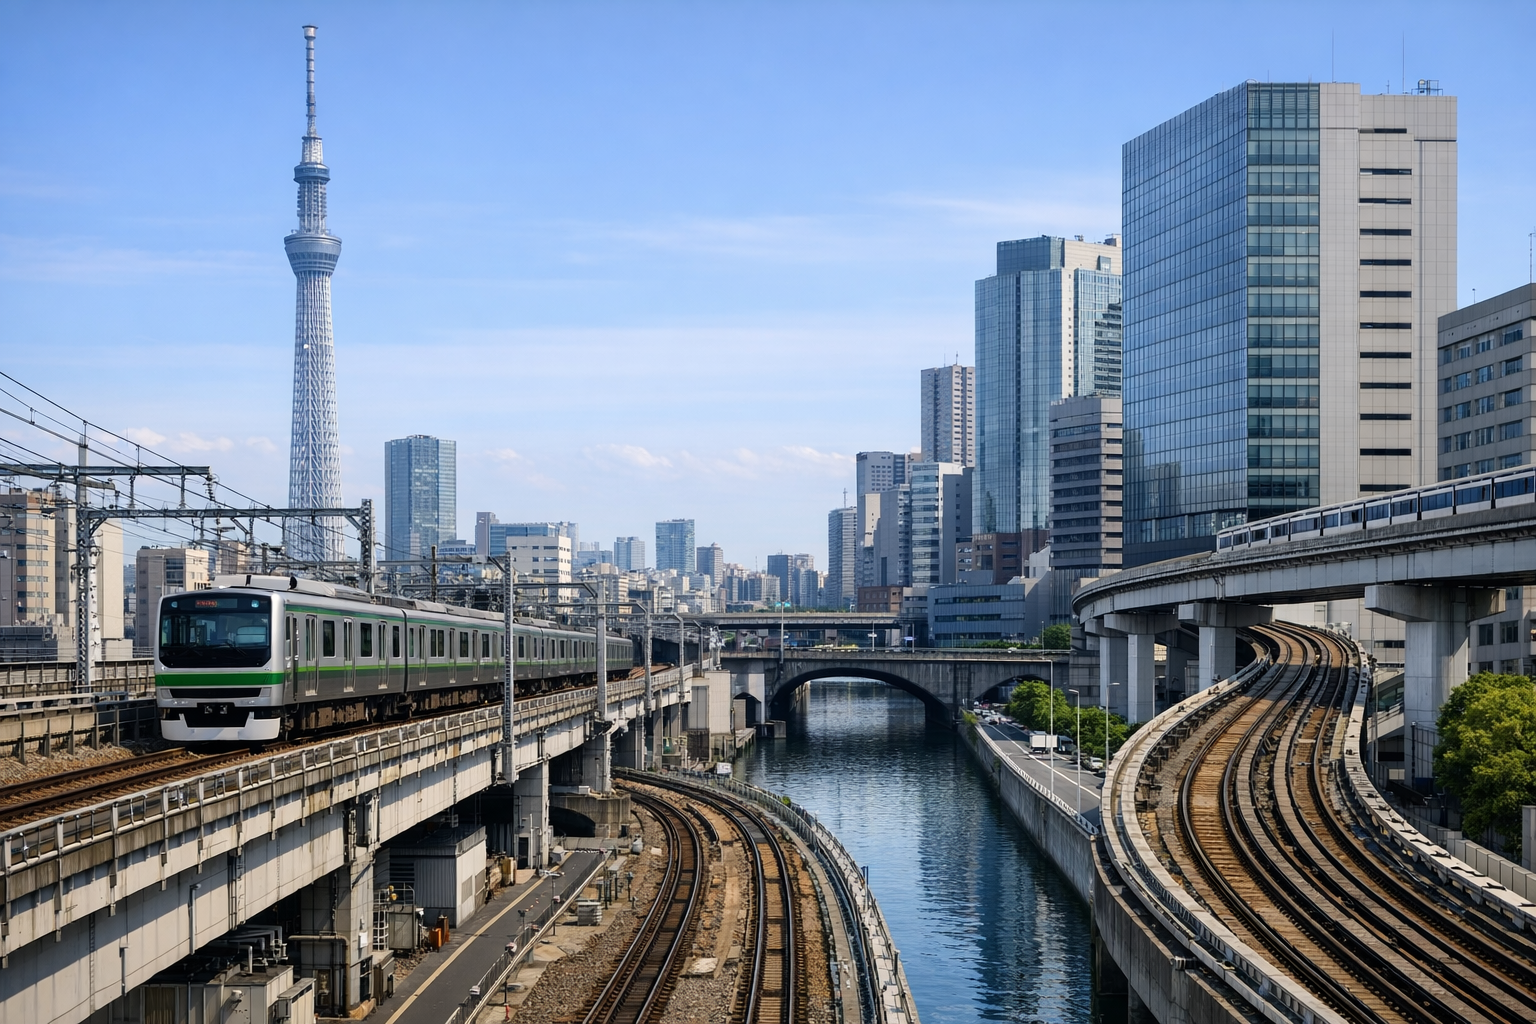
Tokyo still has the stronger case if the question is rail efficiency at megacity scale. Tokyo Metro alone carried an average of 6.84 million passengers a day in FY2024 across 195.0 km and 180 stations, according to the operator’s current Tokyo Metro operating data. Singapore’s strongest current counterclaim is different: the Land Transport Authority reported a 12-month moving average MKBF of 1,673,000 train-km and zero MRT delays above 30 minutes in October 2025, according to the LTA reliability release.
That is why this fight keeps getting muddled. Singapore has the cleaner reliability story, the cleaner reporting structure, and the cleaner institutional model. Tokyo has the harder operating problem: moving enormous passenger volumes across a giant, multi-operator urban region with limited transfer friction and unusually high network intensity. Those are not the same test. A city can win broad mobility rankings and still lose the narrower question of who solves metropolitan rail movement more efficiently at scale.
The viral takeaway is simple: Singapore wins the cleaner benchmark war, but Tokyo still wins the harder transit problem. That does not mean Singapore’s edge in broad rankings is fake or unfair. It means the rankings often reward a different kind of success than the one most people picture when they think about a rail megacity that actually absorbs daily urban demand.
The phrase “urban transit efficiency” sounds straightforward, but it hides a definitional fight. If efficiency means minimizing major disruptions on a centrally managed network, Singapore has a powerful claim. If it means moving vast numbers of riders through a dense urban region with strong network continuity, through-services, and heavy passenger load, Tokyo has the stronger evidence. This is not just a Tokyo-versus-Singapore story. It is a story about what counts as transit excellence in the first place.
That matters because many readers assume rankings settle the debate. They do not. A broad mobility index can reward governance, policy coherence, digital services, and cross-mode planning. A rail-intensive city can still outperform on the narrower task of moving millions of people by train every day. Once those definitions get separated, the argument becomes much clearer.
These numbers explain the split. Tokyo’s evidence is strongest on passenger work performed, network intensity, and metropolitan-scale rail usage. Singapore’s evidence is strongest on reliability discipline, transparency, and operational stability. Both are serious strengths. They just do not prove the same thing.
Tokyo Metro is not the whole Tokyo rail region, but it is the clearest official window into Tokyo’s urban core. The operator runs 9 lines over 195.0 km with 180 stations, and it carried an average of 6.84 million passengers per day in FY2024, according to the current operating summary. Its 2025 fact book adds the stronger throughput measure: 372,917 million passenger-km in FY2025/3.
That matters because passenger-km is harder to dismiss than simple ridership. It captures not just how many people enter the system, but how much transport work the network performs. A metro that handles huge trip volumes over meaningful travel distances is doing something different from a smaller system with excellent reliability on a more compact and centralized footprint.
Tokyo’s case is strongest precisely because the network is not institutionally simple. The capital region relies on interwoven operators, through-services, and intense central demand. What looks messy on an organizational chart can function as a capacity advantage in practice. Riders care less about institutional neatness than about whether the trains connect them to jobs, schools, and interchange corridors with tolerable friction.
Singapore’s case is not weak. It is just different. The Land Transport Authority reported in December 2025 that the MRT network’s 12-month moving average MKBF reached 1,673,000 train-km as of end-October 2025, slightly above the previous month’s 1,671,000 train-km, according to the December 2025 LTA release. The authority also confirmed zero delays exceeding 30 minutes on the MRT network in October.
Those are exceptional operating results by any standard. Singapore deserves credit for building a rail system that is easy to benchmark, easy to govern, and hard to embarrass. Its advantages come from centralized oversight, disciplined reporting, and a policy structure that aligns rail, bus, and car restraint under a single transport logic. In a broad urban mobility index, that is exactly the kind of profile that tends to score well.
So Singapore is not “losing” the transit story. It is winning a different one: the story of how to run a clean, reliable, legible urban rail system with very low disruption rates. That is real transit excellence. It just is not automatically proof that Singapore beats Tokyo on the narrower problem of metropolitan rail efficiency under megacity demand.
For commuters in Tokyo, the gain is direct. A dense rail core with through-running and intense station spacing reduces transfer pain and absorbs very large flows from suburban prefectures into central employment districts. Office workers moving through Shinjuku, Chiyoda, and other interchange-heavy areas benefit from a system built to handle sustained peak loads. Students, service workers, and regional commuters benefit from a network that does not treat long cross-region rail movement as an edge case.
In Singapore, the most immediate gains go to riders who value predictability, low disruption risk, and clean operating discipline. Reliability matters because missed connections, crowding after incidents, and service uncertainty all impose real time costs. A network with zero over-30-minute delays in October 2025 is offering something commuters actually feel. The daily experience is smoother when the system rarely breaks in a visible way.
This is where the argument becomes human rather than technical. Tokyo is solving the stress of moving huge volumes through a giant urban labor market. Singapore is solving the stress of uncertainty and operational failure. Both matter. But they are not the same commuter problem.
Urban transit efficiency can be measured through reliability, throughput, transfer burden, passenger-km, network density, station access, operating cost recovery, or service continuity. These metrics are not interchangeable. A system can be excellent at keeping major incidents rare and still move fewer people through a smaller urban field. Another system can carry immense passenger volumes efficiently while looking less tidy in cross-city comparisons because its institutions are fragmented.
Tokyo and Singapore sit on opposite sides of that divide. Singapore’s transport model is centralized and easier to benchmark because one authority publishes a common statistical frame through the LTA statistics portal and official reports. Tokyo’s model is fragmented institutionally but integrated operationally. Tokyo Metro, Toei, JR East, and private railways divide responsibility in ways that make one-number comparisons harder, even when the rider-facing network functions with high continuity.
That institutional complexity is often mistaken for inefficiency. In reality, it can become a capacity advantage when through-services and network coordination allow a far larger urban field to function as one rail-led labor market. That is one reason Tokyo is so often undervalued in neat international rankings. Its success is harder to summarize in a single agency dashboard.
This is the question that gives the article its real edge. The most obvious objection to Tokyo is Arthur D. Little’s 2025 Urban Mobility Index, which scored Singapore at 70.2% and Tokyo at 65.7%, according to the 2025 index report. If the debate were simply “which city ranks higher in a broad mobility index,” Singapore would win.
But that does not settle the narrower claim in the headline. A broad mobility ranking is not the same as a metro-efficiency test. It wraps together governance, planning coherence, sustainability, accessibility, and other transport-adjacent factors. A city can score higher overall without beating a rival in the specific job of moving huge passenger volumes by rail across a sprawling urban region.
So did Singapore “steal” the rankings from Tokyo? Not literally. There is no sign of anything unfair or manipulated in the ranking outcome. But it is reasonable to argue that broad benchmarks change the game. They can make a cleanly governed, transparently reported, centralized system look decisively superior even when the harder rail-capacity problem is still being solved more impressively elsewhere. In that sense, Singapore did not steal Tokyo’s case. The benchmark simply rewarded a different kind of transit strength.
The cleanest comparison is not between reputations. It is between what the networks are built to do. Using Tokyo Metro’s published figures, 372,917 million passenger-km over 195.0 km equals roughly 1.91 billion passenger-km per route-km in FY2025/3, derived from the two cited inputs in the fact book. That does not represent all of Tokyo rail, but it does signal extremely high network utilization in the urban core.
Station density also matters. Tokyo Metro’s 180 stations over 195.0 km means roughly 0.92 km per station interval, derived from the published route and station totals. High stop density can slow line speeds, but in a central megacity it also expands walk access, supports trip chaining, and reduces the need for non-rail substitutes. This is part of what makes Tokyo’s system so powerful for actual daily use.
Singapore has continued extending reach and improving network quality, but within the provided source set its strongest official edge remains reliability, not a directly matched throughput statistic framed against route length in the same way. That asymmetry does not prove Singapore is weaker overall. It does mean Tokyo’s case is stronger on the specific throughput-heavy definition of efficiency used here.
| Measure | Tokyo Metro | Singapore MRT system |
|---|---|---|
| Strongest case in this source set | Throughput and integration | Reliability and central control |
| Core metric cited | 372,917 million passenger-km in FY2025/3 | 1,673,000 train-km MKBF at end-Oct 2025 |
| Daily scale signal | 6.84 million passengers a day in FY2024 | Reliability-first framing in the provided source set |
| Institutional model | Multi-operator, through-running network | Centralized agency-led system |
Yes, Singapore’s edge in broad mobility rankings is fair within those rankings’ rules. A city that offers strong reliability, centralized governance, consistent reporting, and tightly managed network performance should score very well in benchmark systems built to reward broad mobility outcomes. Singapore did not “cheat” its way into that position. It earned it under the criteria being used.
It was also fairly expected. Centralized systems with strong public reporting tend to compare well internationally because they are easier to measure and defend. Tokyo’s metropolitan rail ecosystem is more operationally complex and institutionally fragmented, which makes it harder to package neatly in the same way. That does not make Tokyo less effective for passengers. It makes Tokyo less convenient for ranking frameworks that prefer clean, system-wide metrics.
Where people overreach is in what they conclude from that result. Saying Singapore outranks Tokyo in a broad mobility benchmark can be correct. Saying that proves Singapore is better at the narrow job of moving massive numbers of riders through a rail megacity is a much bigger claim, and the source set here does not fully support it. That is where the rankings can become misleading even when they are fair.
The disagreement is not a flaw. It is the point. Index compilers are measuring a city package. Operators are measuring transport work. One method asks which urban mobility ecosystem looks strongest overall. Another asks how effectively trains move people, at what scale, and with what continuity. Those are related questions, but they are not identical.
That is why Singapore can beat Tokyo in a broad mobility index while Tokyo still has the better case on rail-based metropolitan throughput. Different tools produce different winners because they are not answering the same question. Once that becomes clear, the apparent contradiction stops being a contradiction at all.
Tokyo’s main challenge is not demand. It is whether the metropolitan network can keep delivering extraordinary throughput as labor costs rise, infrastructure ages, and coordination remains institutionally fragmented. Japan’s MLIT statistical framework remains the authoritative base for tracking the wider system over time, but Tokyo still lacks the kind of single public metro-wide reliability dashboard that would make its performance easier to defend in international comparisons.
Singapore’s next test is scale elasticity. The state has shown that it can run a highly reliable MRT system and integrate that network into a broader transport strategy. The open question is whether the system can maintain its exceptionally low major-delay profile while continuing to grow and absorb more passenger intensity over time. That is where comparisons with heavy-demand systems like Tokyo become more revealing than broad rank tables.
Two systems. Two kinds of efficiency. Singapore wins the cleaner benchmarking story. Tokyo still has the stronger case on the harder rail-mobility task: moving very large numbers of people through a giant urban region with sustained intensity and relatively limited transfer friction.
Is Tokyo’s transit system actually more reliable than Singapore’s?
No clear Tokyo-wide official metric in this source set proves that. Singapore has the stronger current reliability evidence, with a 12-month moving average MKBF of 1,673,000 train-km and zero MRT delays above 30 minutes in October 2025.
Why use Tokyo Metro data if Tokyo has many rail operators?
Because Tokyo Metro provides current, detailed official figures for passenger volume, route length, stations, and financial performance. The article does not treat Tokyo Metro as the whole regional network. It uses Tokyo Metro to show the scale and intensity of the core urban rail system, while the MLIT statistics mark the wider context.
Did Singapore really beat Tokyo in the rankings?
In at least one broad mobility benchmark, yes. Arthur D. Little’s 2025 Urban Mobility Index scored Singapore 70.2% and Tokyo 65.7%. But that index measures a wider mobility package, not only rail throughput and transfer efficiency.
Did Singapore “steal” the rankings from Tokyo?
No. Singapore’s strong ranking position is fair within the rules of broader mobility indexes. The more accurate criticism is that these indexes often measure a different game from the one implied by the narrower claim about rail efficiency at megacity scale.
Was Singapore’s edge fair and expected?
Yes. It was fair because Singapore performed strongly on the kinds of system-wide mobility factors broad indexes reward. It was also expected because centralized, clearly reported systems tend to compare well internationally. That still does not automatically settle the narrower Tokyo-versus-Singapore rail-efficiency argument.
What does “efficiency” mean in this comparison?
Here it mainly means how effectively a system moves large numbers of passengers through an urban region with limited transfer friction and high network use. Reliability matters, but it is treated as one test rather than the only test.
This comparison matters because city branding increasingly treats transit rankings as shorthand for overall urban competence. Tokyo and Singapore are both used as global reference points for how high-functioning cities should move people. But they represent different models of excellence.
Tokyo shows what rail can do when an enormous metropolitan labor market is stitched together through deep network intensity and operational integration. Singapore shows what a highly reliable, centrally managed transport state can achieve when planning, reporting, and performance control are tightly aligned. Readers looking for one clean winner are usually flattening two very different kinds of success.
For commuters, the practical stakes are obvious. Tokyo’s model prioritizes the ability to move huge numbers of riders across a giant region with strong continuity, which affects access to jobs, universities, and central business districts.
Singapore’s model prioritizes consistency and low disruption, which affects rider stress, predictability, and the daily cost of delays. For planners and investors, the distinction is just as important. A city can look “better” in a benchmark because it is easier to govern and measure, while another can remain stronger at the harder real-world task of carrying metropolitan demand at scale. That is why the Tokyo-versus-Singapore debate is worth more than a simple rank table.