Physical Address
304 North Cardinal St.
Dorchester Center, MA 02124
Physical Address
304 North Cardinal St.
Dorchester Center, MA 02124

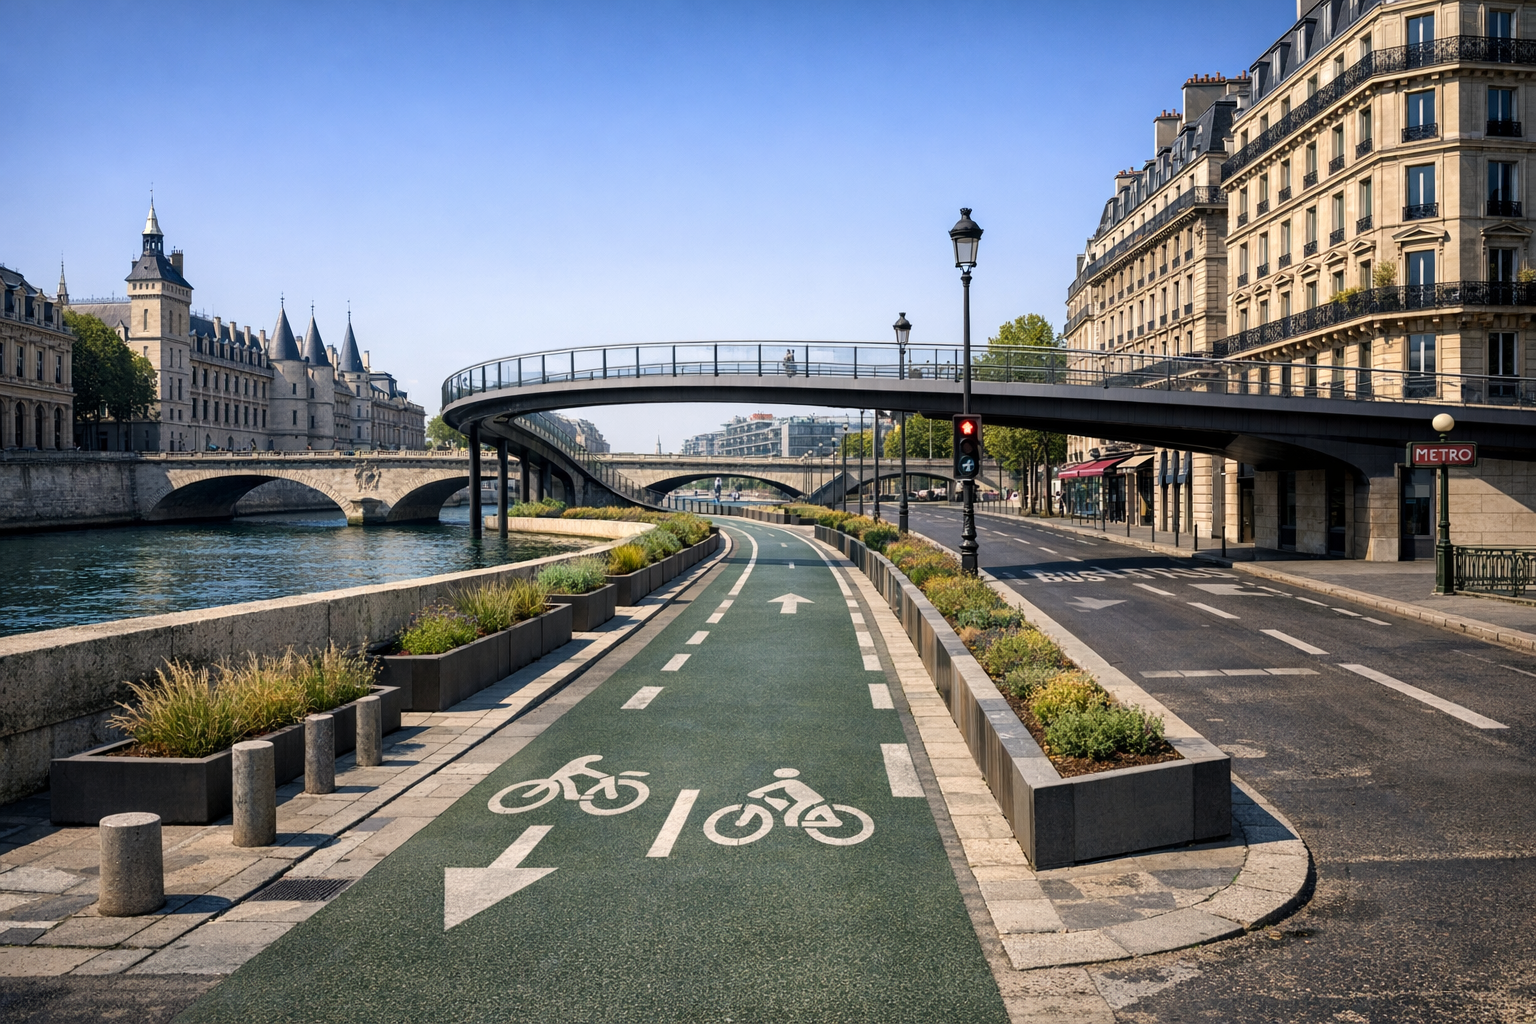
Paris is currently beating London on the quality and coherence of urban cycling infrastructure, even though London records far more daily bike trips. Paris entered 2026 with a cycling plan worth more than €250 million for 2021 to 2026, a stated goal of becoming “100% bikeable” by 2026, and an Olympic legacy network that added 105 km of routes and 13,000 bike parking spaces around venues, according to the City of Paris cycling plan and the Apur Olympistes network summary. Transport for London reports its cycle network now exceeds 431 km and daily cycling journeys reached 1.5 million in 2025, up 43% since 2019, according to TfL’s December 2025 release.
The gap is not about whether Londoners cycle. They do, at scale. The stronger case for Paris is narrower and more defensible: Paris has built a more coherent protected street network, backed by a single city-led programme and reinforced by metropolitan corridors, while London still relies on a split delivery model across TfL and borough councils. The clearest independent test came in May 2025, when the Clean Cities Campaign ranked Paris 1st in its child-friendly streets index and Greater London 14th, based on protected lanes, low-speed streets, and school access, according to the 2025 Streets for Kids ranking report.
The Paris-London comparison turns on network quality, governance, and speed of delivery. The relevant geographies are not identical, and that caveat should be stated plainly. Some Paris figures refer to the City of Paris, others to Grand Paris Metropolis, and London data may refer to Greater London or TfL-managed routes. Raw kilometre counts do not settle the main question. The stronger result in Paris comes from continuous protected corridors, city-led funding between 2021 and 2026, and the policy trigger of the 2024 Olympics, rather than from ridership volume alone.
The most honest answer is that Paris’s lead looks deserved on the criteria being measured, but the comparison is not perfect and should not be overstated. London is not losing because people there do not cycle. London is losing because the available independent benchmark rewards protected continuity, low-speed street coverage, and safer school access, and Paris performs much better on those measures.
That means this is not really a verdict on which city has the most cyclists or the strongest cycling culture in every sense. It is a verdict on which capital is currently delivering a more legible and safer street system for everyday riders. On that narrower and more useful question, the balance of evidence favors Paris.
The strongest single piece of comparative evidence is not a municipal press release. It is the 2025 Streets for Kids ranking from Clean Cities Campaign, which scored cities and metropolitan areas on three measures: protected cycling infrastructure, school street coverage, and the share of streets with a 30 km/h speed limit or equivalent low-speed environment. On that index, Paris scored 23.7 points (78.9%) and ranked 1st. Greater London scored 12.6 points (42.0%) and ranked 14th, according to the campaign’s May 2025 report.
That matters because the ranking is closer to lived street safety than to city branding. It does not ask which capital has the strongest image or the biggest cycling subculture. It asks whether the network around children, schools, and everyday trips is protected and calm enough to be widely usable. Paris wins clearly on that test.
Urban cycling infrastructure is not one asset. It is a street network, a set of operating rules, and a funding programme that decides which corridors are protected, where intersections are redesigned, how bike parking is added, and whether local sections connect across district boundaries. A painted lane, a low-traffic street, and a protected corridor can all count as cycling provision in public debate, but they do not perform the same function. Protected continuity matters most where cycling competes with fast vehicle traffic.
That is why Paris and London can both report growth and still produce different user experiences. The City of Paris is pursuing a single stated programme for a bikeable city. London’s system is shared between TfL and borough councils, with standards set centrally but delivery spread across local authorities. The same split appears in other large cities: Berlin has district-level implementation under a citywide mobility law, and Copenhagen uses a more unified municipal framework. The institutional structure affects route continuity, timing, and maintenance. Those are system effects, not branding choices.
Paris’s edge starts with programme design. The city’s current cycling plan covers 2021 to 2026 and commits more than €250 million, following a previous plan worth €150 million for 2015 to 2020, according to the municipal plan page. That continuity matters. Paris is not treating cycling as a sequence of standalone corridor upgrades. It is treating it as a funded city service with a multi-year build cycle.
The plan also sets a simple and testable target: a “100% bikeable” city by 2026. That phrase is political language, but the delivery tools underneath it are concrete. The city ties the goal to route continuity, links with the regional RER-Vélo and Vélopolitain concepts, and expansion of secure bike parking. This is closer to how Copenhagen’s municipal approach has long framed cycling, as a network problem with supporting storage and interchange, than to the stop-start corridor politics seen in many UK boroughs. Paris is also pointing metropolitan planning bodies and city hall in the same direction. That alignment is not perfect, but it is much tighter than London’s.
London’s recent cycling growth is real. TfL’s Travel in London 2025 report says the capital reached 1.5 million daily cycling journeys in 2025, up from 1.33 million in 2024 and up 43% since 2019, according to the agency’s active travel trends report. On volume, London leads by a wide margin. No serious comparison should minimise that.
Volume and network quality are separate measures. A rider in central London may find protected routes to major destinations, yet a commuter in an outer borough can still face painted lanes or no dedicated space. That fragmentation does not show up in the daily journey count. It shows up in who feels safe cycling and who does not. The Clean Cities ranking captured this by measuring continuity and low-speed street coverage, not just total ridership.
The school streets data shows why counting one intervention can mislead. Greater London had more than 500 school streets during the 2025 Clean Cities assessment. Paris had 82 of 314 primary schools covered by closures or pedestrianisation at that point, with a target of 300 school streets by 2026, based on the same ranking report. On that metric alone, London looks stronger. It is stronger.
School streets are one tool in a wider toolkit. The Clean Cities ranking also measured protected cycling lanes and the percentage of streets with 30 km/h speed limits or equivalent. Paris scored much higher on those measures. A child walking or cycling to school benefits most when the route beyond the school gate is also safe. London’s school streets are islands in a less coherent network.
Paris also benefited from something London did not have in the same period: a fixed external deadline tied to a major event. Apur says the Olympistes network totals 105 km of cycle paths and was developed by the City of Paris, Seine-Saint-Denis, Grand Paris Metropolis, and the Paris 2024 Organising Committee. It linked major venues including Parc des Princes, Roland-Garros, Bercy Arena, Stade de France, and the Athletes’ Village. The programme also added 13,000 bike parking places around competition venues, according to the Apur Olympic network page.
That matters because deadlines change delivery behavior. The Olympics gave Paris an administrative forcing mechanism. A route either had to be ready or it did not. Temporary urgency became permanent corridor construction. London has had cycling successes without an Olympic-style deadline in this period, but Paris used the event cycle to accelerate network coherence in a way that is now visible in the street map.
Ridership data supports both sides of the comparison, depending on what is being tested. London’s total daily cycling volume is far higher. TfL’s estimate of 1.5 million daily journeys in 2025 is a total network figure. The most useful Paris usage figure in the source pack is narrower. Apur reports that in September 2024 there were 170,300 Vélib’ journeys on an average working day, using nearly 19,700 bikes across more than 65 municipalities in Grand Paris, according to Apur’s Greater Paris cycling note. Vélib’ is only bike-share. It is not total cycling demand.
That is why the most defensible summary is this: London wins on volume, Paris wins on delivery quality. One figure captures total use. The other comparison captures whether the street system is becoming more continuous, protected, and easy for ordinary riders to understand. Those are different achievements.
The first group affected is everyday riders making short urban trips. In Paris, the beneficiaries are concentrated in the dense inner city and in corridors stretching into municipalities of Grand Paris where the network is being stitched together. The effect is strongest for school trips, station access, and short errands. Where protected links connect housing blocks to metro and RER stops, cycling shifts from an occasional mode to a routine feeder. The added 13,000 parking spaces around Olympic venues also point to a wider parking logic that supports interchanges and event access, not just leisure cycling.
In London, the geography is less even. Riders in boroughs with strong local political support and capital funding can gain high-quality protected routes, yet adjacent boroughs may deliver slower or weaker schemes. That creates sharp corridor differences across the same urban region. Families near school streets benefit at drop-off and pickup times, but the larger advantage still depends on whether routes beyond those gates are coherent. Freight operators and drivers are affected too, because protected cycling often changes kerb space, loading arrangements, and junction design. The biggest long-run effect falls on residents who do not cycle yet. A network that feels safe changes the pool of potential users. A fragmented one tends to keep cycling concentrated among riders already comfortable with risk.
The best explanation for Paris’s current lead is institutional. The City of Paris can set a citywide programme, assign multi-year funding, and coordinate that programme with metropolitan bodies around a shared network concept. Grand Paris Metropolis and Apur provide the planning scale that lets local corridors fit into a larger map. The Olympics added an administrative forcing mechanism. A route either had to be ready or it did not. That compresses delay.
London’s governance is more distributed. TfL sets standards and funds major routes, but boroughs control local streets and make their own investment choices. That flexibility allows tailored solutions but also creates gaps. A rider crossing a borough boundary may encounter a change in lane width, surface quality, or protection level. Those micro-breaks accumulate into a sense of discontinuity. Paris’s model is not necessarily superior for all contexts, but for a capital city with high cycling demand, it has delivered faster network coherence.
Paris’s next test is straightforward. The city has tied its credibility to a 2026 deadline for a bikeable network, and Clean Cities says it is aiming for 300 school streets by 2026. The metropolitan test is just as important. If the 617 km structuring network remains coherent across municipal lines, Paris will have moved from inner-city improvement to region-scale utility. If not, the current lead could narrow.
London’s path is less binary but slower to read. Cycling Action Plan 2 gives TfL a current framework, and recent growth in journeys shows there is demand for more capacity. The key issue is whether that demand can be matched by a more continuous network across borough boundaries. London does not need Paris’s exact model. It does need fewer breaks in authority, standards, and delivery timing. If the network keeps expanding only in pieces, London can continue posting strong usage growth and still trail on the quality measures that shape who feels able to ride.
Does London have more cyclists than Paris?London has the larger total count in the cited data. TfL estimated 1.5 million daily cycling journeys in 2025. The Paris source pack does not provide a directly comparable total citywide daily cycling figure. Its strongest recent usage number is 170,300 average weekday Vélib’ journeys in September 2024, which covers bike-share only.
Why did Paris rank higher if London has more school streets?Because the Clean Cities ranking measured more than school streets. It also assessed protected cycling infrastructure and low-speed street coverage. London led on school street quantity, but Paris scored much better across the wider street network.
What role did the Paris Olympics play?The Games accelerated route delivery. Apur says the Olympistes network added 105 km of cycle paths and 13,000 parking spaces around venues, with links to major sites including Stade de France and the Athletes’ Village. Paris used an event deadline to build corridors with longer-term utility.
What should London do differently?London’s main challenge is fragmentation across TfL and borough councils. Tighter coordination on network standards, faster delivery timelines, and more consistent funding would help close the quality gap. London does not need to copy Paris’s exact governance model, but it does need fewer breaks in route continuity and protection levels.
So who is really ahead right now?If the question is total cycling volume, London is ahead. If the question is which capital is currently building a more coherent and protected urban cycling system, the evidence in this comparison points to Paris.